Immigrants from Burma/Myanmar vs White/Caucasian Unemployment Among Ages 30 to 34 years
COMPARE
Immigrants from Burma/Myanmar
White/Caucasian
Unemployment Among Ages 30 to 34 years
Unemployment Among Ages 30 to 34 years Comparison
Immigrants from Burma/Myanmar
Whites/Caucasians
5.1%
UNEMPLOYMENT AMONG AGES 30 TO 34 YEARS
98.1/ 100
METRIC RATING
52nd/ 347
METRIC RANK
5.7%
UNEMPLOYMENT AMONG AGES 30 TO 34 YEARS
9.2/ 100
METRIC RATING
210th/ 347
METRIC RANK
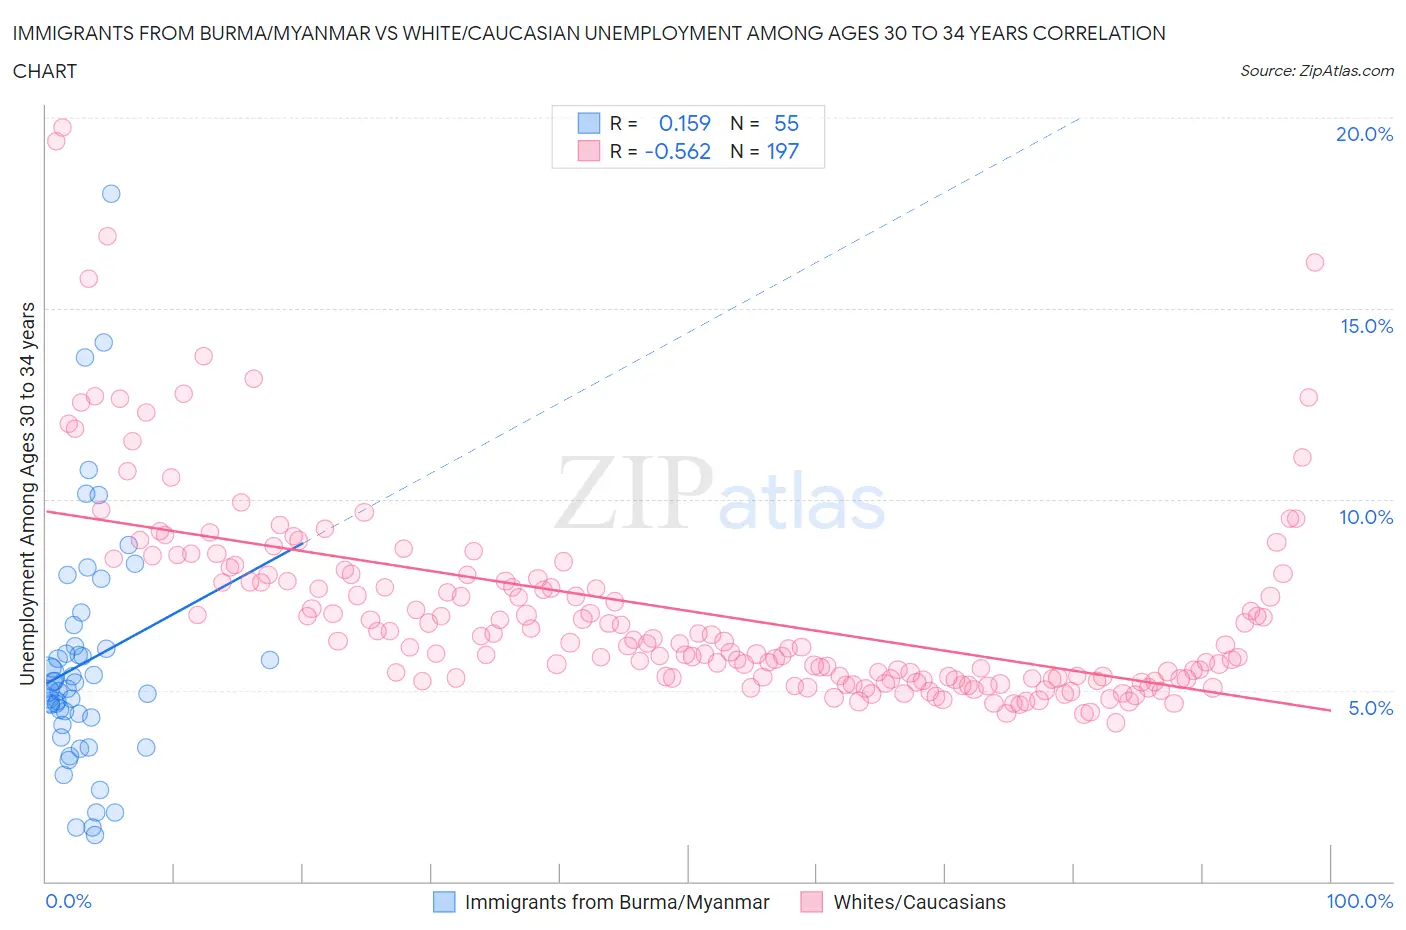
Immigrants from Burma/Myanmar vs White/Caucasian Unemployment Among Ages 30 to 34 years Correlation Chart
The statistical analysis conducted on geographies consisting of 168,858,886 people shows a poor positive correlation between the proportion of Immigrants from Burma/Myanmar and unemployment rate among population between the ages 30 and 34 in the United States with a correlation coefficient (R) of 0.159 and weighted average of 5.1%. Similarly, the statistical analysis conducted on geographies consisting of 504,774,287 people shows a substantial negative correlation between the proportion of Whites/Caucasians and unemployment rate among population between the ages 30 and 34 in the United States with a correlation coefficient (R) of -0.562 and weighted average of 5.7%, a difference of 11.7%.
Unemployment Among Ages 30 to 34 years Correlation Summary
| Measurement | Immigrants from Burma/Myanmar | White/Caucasian |
| Minimum | 1.2% | 4.2% |
| Maximum | 18.0% | 19.7% |
| Range | 16.8% | 15.6% |
| Mean | 5.7% | 7.1% |
| Median | 5.0% | 6.2% |
| Interquartile 25% (IQ1) | 4.1% | 5.3% |
| Interquartile 75% (IQ3) | 6.2% | 8.0% |
| Interquartile Range (IQR) | 2.1% | 2.7% |
| Standard Deviation (Sample) | 3.2% | 2.6% |
| Standard Deviation (Population) | 3.1% | 2.6% |
Similar Demographics by Unemployment Among Ages 30 to 34 years
Demographics Similar to Immigrants from Burma/Myanmar by Unemployment Among Ages 30 to 34 years
In terms of unemployment among ages 30 to 34 years, the demographic groups most similar to Immigrants from Burma/Myanmar are Turkish (5.1%, a difference of 0.040%), Cuban (5.1%, a difference of 0.050%), Puget Sound Salish (5.1%, a difference of 0.070%), Immigrants from Malaysia (5.1%, a difference of 0.14%), and Immigrants from Morocco (5.1%, a difference of 0.23%).
| Demographics | Rating | Rank | Unemployment Among Ages 30 to 34 years |
| Yugoslavians | 98.6 /100 | #45 | Exceptional 5.1% |
| Immigrants | Congo | 98.4 /100 | #46 | Exceptional 5.1% |
| Cypriots | 98.4 /100 | #47 | Exceptional 5.1% |
| Assyrians/Chaldeans/Syriacs | 98.4 /100 | #48 | Exceptional 5.1% |
| Immigrants | Malaysia | 98.3 /100 | #49 | Exceptional 5.1% |
| Puget Sound Salish | 98.2 /100 | #50 | Exceptional 5.1% |
| Turks | 98.2 /100 | #51 | Exceptional 5.1% |
| Immigrants | Burma/Myanmar | 98.1 /100 | #52 | Exceptional 5.1% |
| Cubans | 98.1 /100 | #53 | Exceptional 5.1% |
| Immigrants | Morocco | 97.9 /100 | #54 | Exceptional 5.1% |
| Chinese | 97.7 /100 | #55 | Exceptional 5.1% |
| Immigrants | Serbia | 97.4 /100 | #56 | Exceptional 5.1% |
| Immigrants | China | 97.2 /100 | #57 | Exceptional 5.1% |
| Asians | 97.2 /100 | #58 | Exceptional 5.1% |
| Swedes | 97.1 /100 | #59 | Exceptional 5.1% |
Demographics Similar to Whites/Caucasians by Unemployment Among Ages 30 to 34 years
In terms of unemployment among ages 30 to 34 years, the demographic groups most similar to Whites/Caucasians are Spanish American Indian (5.7%, a difference of 0.10%), Scotch-Irish (5.7%, a difference of 0.11%), French (5.7%, a difference of 0.31%), Immigrants from Philippines (5.7%, a difference of 0.43%), and Immigrants (5.7%, a difference of 0.47%).
| Demographics | Rating | Rank | Unemployment Among Ages 30 to 34 years |
| Koreans | 20.7 /100 | #203 | Fair 5.6% |
| Immigrants | Cameroon | 18.4 /100 | #204 | Poor 5.6% |
| Immigrants | Costa Rica | 14.4 /100 | #205 | Poor 5.6% |
| Alsatians | 14.3 /100 | #206 | Poor 5.6% |
| Israelis | 12.8 /100 | #207 | Poor 5.6% |
| Immigrants | Philippines | 11.5 /100 | #208 | Poor 5.7% |
| French | 10.8 /100 | #209 | Poor 5.7% |
| Whites/Caucasians | 9.2 /100 | #210 | Tragic 5.7% |
| Spanish American Indians | 8.7 /100 | #211 | Tragic 5.7% |
| Scotch-Irish | 8.6 /100 | #212 | Tragic 5.7% |
| Immigrants | Immigrants | 7.1 /100 | #213 | Tragic 5.7% |
| Immigrants | Panama | 5.9 /100 | #214 | Tragic 5.7% |
| Immigrants | Cambodia | 5.8 /100 | #215 | Tragic 5.7% |
| Immigrants | Syria | 5.5 /100 | #216 | Tragic 5.7% |
| Immigrants | Fiji | 5.1 /100 | #217 | Tragic 5.7% |