Immigrants from Burma/Myanmar vs White/Caucasian 5th Grade
COMPARE
Immigrants from Burma/Myanmar
White/Caucasian
5th Grade
5th Grade Comparison
Immigrants from Burma/Myanmar
Whites/Caucasians
96.1%
5TH GRADE
0.0/ 100
METRIC RATING
304th/ 347
METRIC RANK
97.9%
5TH GRADE
99.8/ 100
METRIC RATING
58th/ 347
METRIC RANK
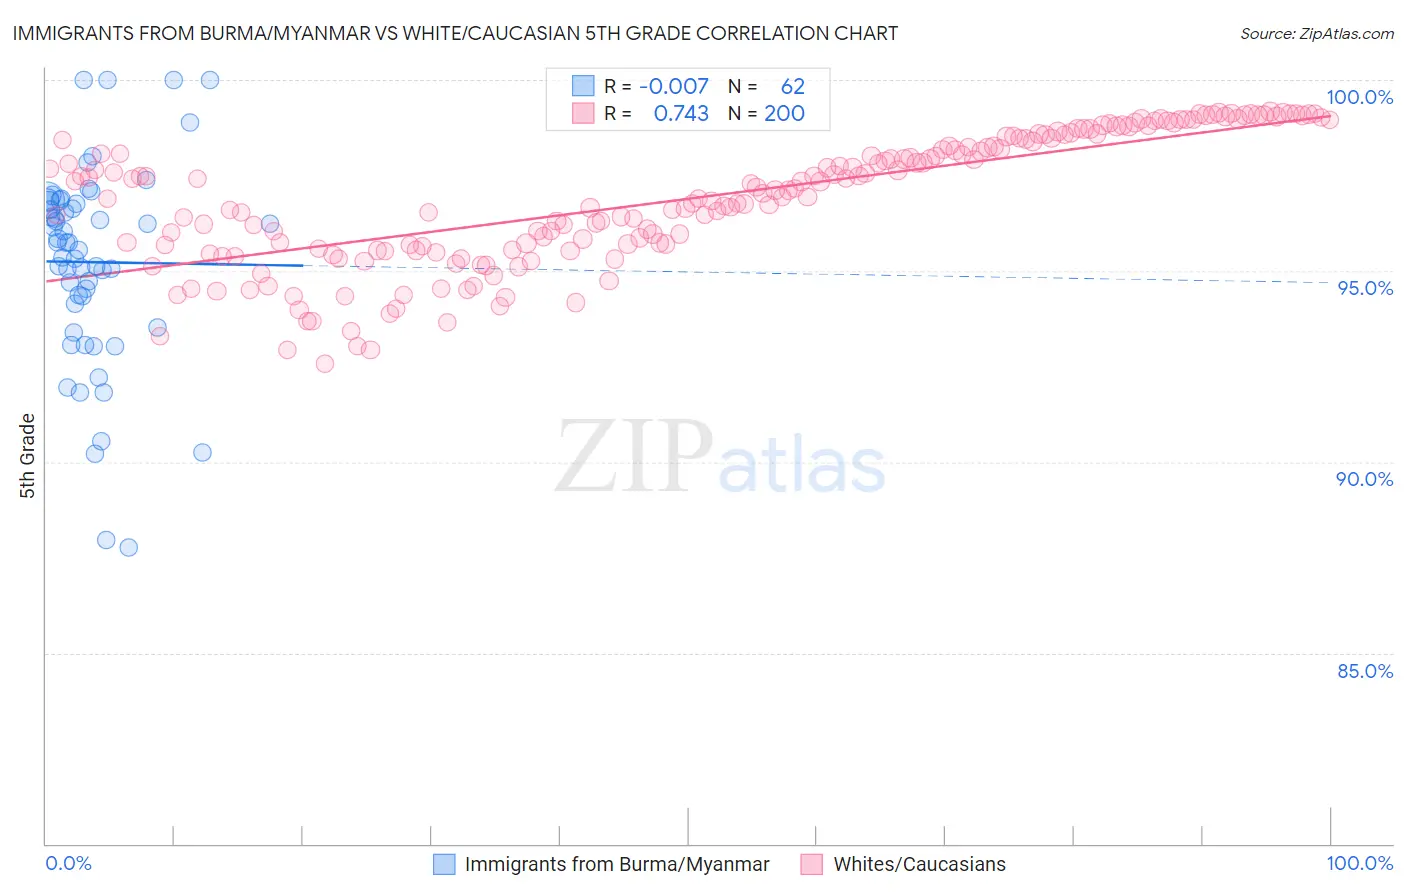
Immigrants from Burma/Myanmar vs White/Caucasian 5th Grade Correlation Chart
The statistical analysis conducted on geographies consisting of 172,326,083 people shows no correlation between the proportion of Immigrants from Burma/Myanmar and percentage of population with at least 5th grade education in the United States with a correlation coefficient (R) of -0.007 and weighted average of 96.1%. Similarly, the statistical analysis conducted on geographies consisting of 585,247,232 people shows a strong positive correlation between the proportion of Whites/Caucasians and percentage of population with at least 5th grade education in the United States with a correlation coefficient (R) of 0.743 and weighted average of 97.9%, a difference of 2.0%.
5th Grade Correlation Summary
| Measurement | Immigrants from Burma/Myanmar | White/Caucasian |
| Minimum | 87.8% | 92.6% |
| Maximum | 100.0% | 99.2% |
| Range | 12.2% | 6.6% |
| Mean | 95.2% | 96.9% |
| Median | 95.7% | 97.1% |
| Interquartile 25% (IQ1) | 94.1% | 95.6% |
| Interquartile 75% (IQ3) | 96.8% | 98.5% |
| Interquartile Range (IQR) | 2.7% | 2.8% |
| Standard Deviation (Sample) | 2.6% | 1.7% |
| Standard Deviation (Population) | 2.6% | 1.7% |
Similar Demographics by 5th Grade
Demographics Similar to Immigrants from Burma/Myanmar by 5th Grade
In terms of 5th grade, the demographic groups most similar to Immigrants from Burma/Myanmar are Immigrants from Laos (96.0%, a difference of 0.010%), Puerto Rican (96.1%, a difference of 0.030%), Immigrants from Haiti (96.0%, a difference of 0.030%), Immigrants from Caribbean (96.0%, a difference of 0.030%), and Guyanese (96.1%, a difference of 0.040%).
| Demographics | Rating | Rank | 5th Grade |
| Haitians | 0.0 /100 | #297 | Tragic 96.3% |
| Immigrants | Dominica | 0.0 /100 | #298 | Tragic 96.2% |
| Immigrants | Immigrants | 0.0 /100 | #299 | Tragic 96.2% |
| Sri Lankans | 0.0 /100 | #300 | Tragic 96.1% |
| Immigrants | Cuba | 0.0 /100 | #301 | Tragic 96.1% |
| Guyanese | 0.0 /100 | #302 | Tragic 96.1% |
| Puerto Ricans | 0.0 /100 | #303 | Tragic 96.1% |
| Immigrants | Burma/Myanmar | 0.0 /100 | #304 | Tragic 96.1% |
| Immigrants | Laos | 0.0 /100 | #305 | Tragic 96.0% |
| Immigrants | Haiti | 0.0 /100 | #306 | Tragic 96.0% |
| Immigrants | Caribbean | 0.0 /100 | #307 | Tragic 96.0% |
| Ecuadorians | 0.0 /100 | #308 | Tragic 96.0% |
| Immigrants | Guyana | 0.0 /100 | #309 | Tragic 96.0% |
| Indonesians | 0.0 /100 | #310 | Tragic 96.0% |
| Immigrants | Bangladesh | 0.0 /100 | #311 | Tragic 96.0% |
Demographics Similar to Whites/Caucasians by 5th Grade
In terms of 5th grade, the demographic groups most similar to Whites/Caucasians are Greek (97.9%, a difference of 0.0%), Austrian (97.9%, a difference of 0.0%), Australian (98.0%, a difference of 0.010%), Creek (98.0%, a difference of 0.010%), and American (97.9%, a difference of 0.010%).
| Demographics | Rating | Rank | 5th Grade |
| Celtics | 99.8 /100 | #51 | Exceptional 98.0% |
| Maltese | 99.8 /100 | #52 | Exceptional 98.0% |
| Slavs | 99.8 /100 | #53 | Exceptional 98.0% |
| Australians | 99.8 /100 | #54 | Exceptional 98.0% |
| Creek | 99.8 /100 | #55 | Exceptional 98.0% |
| Greeks | 99.8 /100 | #56 | Exceptional 97.9% |
| Austrians | 99.8 /100 | #57 | Exceptional 97.9% |
| Whites/Caucasians | 99.8 /100 | #58 | Exceptional 97.9% |
| Americans | 99.7 /100 | #59 | Exceptional 97.9% |
| Immigrants | Canada | 99.7 /100 | #60 | Exceptional 97.9% |
| Serbians | 99.7 /100 | #61 | Exceptional 97.9% |
| Immigrants | North America | 99.7 /100 | #62 | Exceptional 97.9% |
| Russians | 99.7 /100 | #63 | Exceptional 97.9% |
| Immigrants | Northern Europe | 99.6 /100 | #64 | Exceptional 97.9% |
| Canadians | 99.6 /100 | #65 | Exceptional 97.9% |