Immigrants from Burma/Myanmar vs Seminole Unemployment Among Women with Children Under 18 years
COMPARE
Immigrants from Burma/Myanmar
Seminole
Unemployment Among Women with Children Under 18 years
Unemployment Among Women with Children Under 18 years Comparison
Immigrants from Burma/Myanmar
Seminole
5.4%
UNEMPLOYMENT AMONG WOMEN WITH CHILDREN UNDER 18 YEARS
69.5/ 100
METRIC RATING
158th/ 347
METRIC RANK
6.0%
UNEMPLOYMENT AMONG WOMEN WITH CHILDREN UNDER 18 YEARS
0.5/ 100
METRIC RATING
252nd/ 347
METRIC RANK
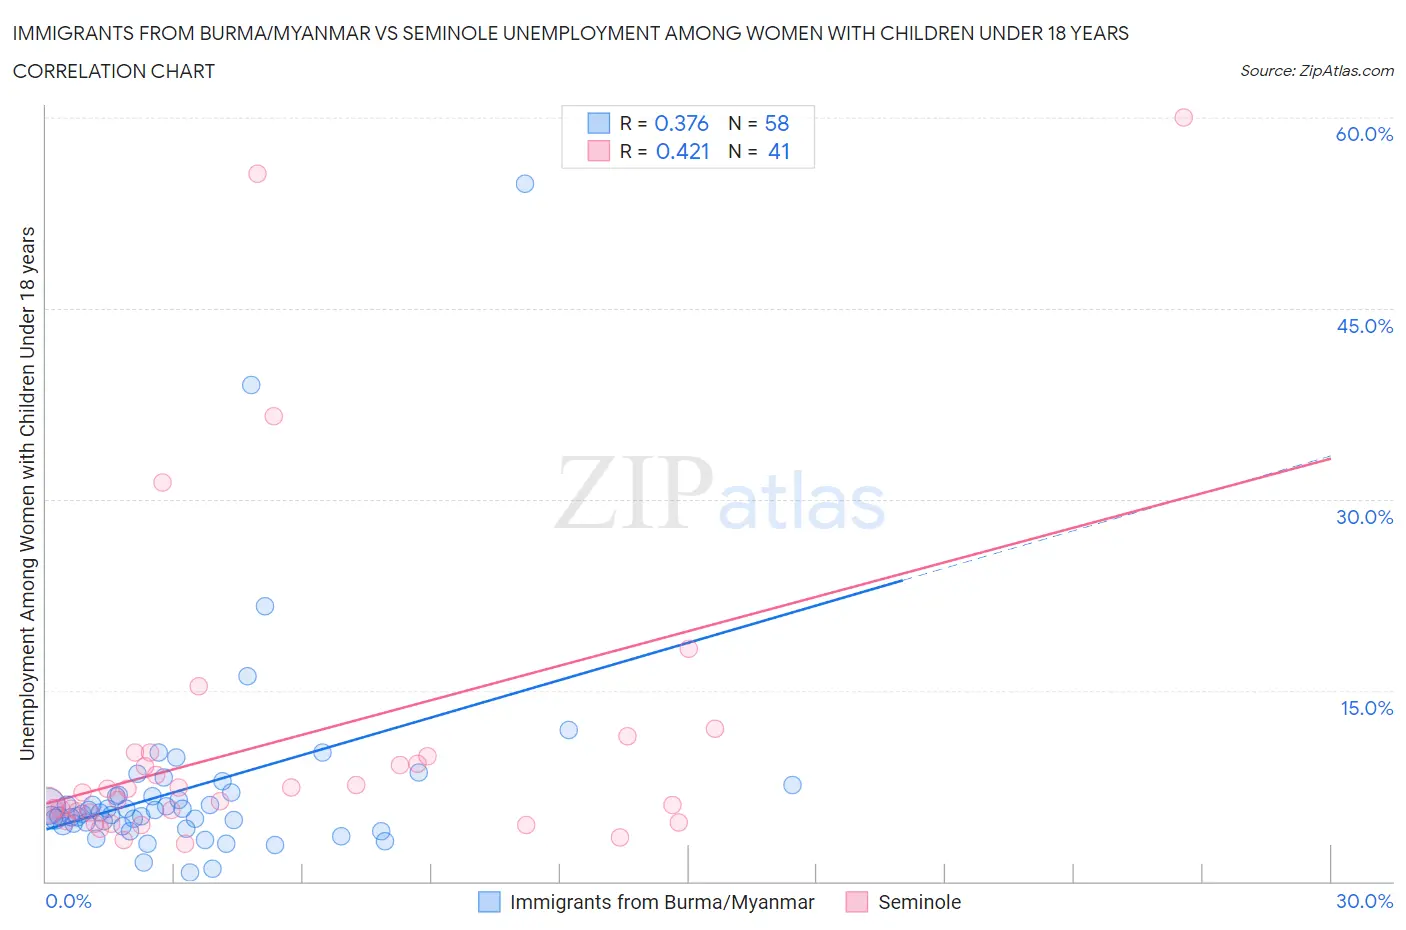
Immigrants from Burma/Myanmar vs Seminole Unemployment Among Women with Children Under 18 years Correlation Chart
The statistical analysis conducted on geographies consisting of 170,433,276 people shows a mild positive correlation between the proportion of Immigrants from Burma/Myanmar and unemployment rate among women with children under the age of 18 in the United States with a correlation coefficient (R) of 0.376 and weighted average of 5.4%. Similarly, the statistical analysis conducted on geographies consisting of 116,531,030 people shows a moderate positive correlation between the proportion of Seminole and unemployment rate among women with children under the age of 18 in the United States with a correlation coefficient (R) of 0.421 and weighted average of 6.0%, a difference of 11.0%.
Unemployment Among Women with Children Under 18 years Correlation Summary
| Measurement | Immigrants from Burma/Myanmar | Seminole |
| Minimum | 0.70% | 3.0% |
| Maximum | 54.8% | 60.0% |
| Range | 54.1% | 57.0% |
| Mean | 7.3% | 11.0% |
| Median | 5.3% | 6.9% |
| Interquartile 25% (IQ1) | 4.3% | 5.1% |
| Interquartile 75% (IQ3) | 6.8% | 9.9% |
| Interquartile Range (IQR) | 2.5% | 4.9% |
| Standard Deviation (Sample) | 8.4% | 12.6% |
| Standard Deviation (Population) | 8.3% | 12.5% |
Similar Demographics by Unemployment Among Women with Children Under 18 years
Demographics Similar to Immigrants from Burma/Myanmar by Unemployment Among Women with Children Under 18 years
In terms of unemployment among women with children under 18 years, the demographic groups most similar to Immigrants from Burma/Myanmar are German Russian (5.4%, a difference of 0.060%), South African (5.4%, a difference of 0.070%), Korean (5.4%, a difference of 0.090%), Chickasaw (5.4%, a difference of 0.090%), and Carpatho Rusyn (5.4%, a difference of 0.11%).
| Demographics | Rating | Rank | Unemployment Among Women with Children Under 18 years |
| Immigrants | Iran | 71.1 /100 | #151 | Good 5.4% |
| Immigrants | South Eastern Asia | 71.1 /100 | #152 | Good 5.4% |
| Carpatho Rusyns | 70.8 /100 | #153 | Good 5.4% |
| Immigrants | Latvia | 70.8 /100 | #154 | Good 5.4% |
| Koreans | 70.5 /100 | #155 | Good 5.4% |
| South Africans | 70.3 /100 | #156 | Good 5.4% |
| German Russians | 70.2 /100 | #157 | Good 5.4% |
| Immigrants | Burma/Myanmar | 69.5 /100 | #158 | Good 5.4% |
| Chickasaw | 68.4 /100 | #159 | Good 5.4% |
| Afghans | 66.6 /100 | #160 | Good 5.4% |
| Immigrants | Iraq | 65.9 /100 | #161 | Good 5.4% |
| Immigrants | Saudi Arabia | 65.0 /100 | #162 | Good 5.4% |
| Lebanese | 64.7 /100 | #163 | Good 5.4% |
| Celtics | 63.0 /100 | #164 | Good 5.4% |
| Tlingit-Haida | 61.9 /100 | #165 | Good 5.4% |
Demographics Similar to Seminole by Unemployment Among Women with Children Under 18 years
In terms of unemployment among women with children under 18 years, the demographic groups most similar to Seminole are Immigrants from Congo (6.0%, a difference of 0.21%), Ute (5.9%, a difference of 0.62%), Immigrants from Cabo Verde (5.9%, a difference of 0.63%), Immigrants from Cameroon (5.9%, a difference of 0.70%), and Delaware (5.9%, a difference of 0.85%).
| Demographics | Rating | Rank | Unemployment Among Women with Children Under 18 years |
| Ugandans | 1.1 /100 | #245 | Tragic 5.9% |
| Uruguayans | 1.0 /100 | #246 | Tragic 5.9% |
| Cape Verdeans | 1.0 /100 | #247 | Tragic 5.9% |
| Delaware | 0.8 /100 | #248 | Tragic 5.9% |
| Immigrants | Cameroon | 0.8 /100 | #249 | Tragic 5.9% |
| Immigrants | Cabo Verde | 0.7 /100 | #250 | Tragic 5.9% |
| Ute | 0.7 /100 | #251 | Tragic 5.9% |
| Seminole | 0.5 /100 | #252 | Tragic 6.0% |
| Immigrants | Congo | 0.4 /100 | #253 | Tragic 6.0% |
| Immigrants | Azores | 0.3 /100 | #254 | Tragic 6.0% |
| Liberians | 0.2 /100 | #255 | Tragic 6.0% |
| Nepalese | 0.2 /100 | #256 | Tragic 6.0% |
| Bermudans | 0.1 /100 | #257 | Tragic 6.1% |
| Immigrants | Nigeria | 0.1 /100 | #258 | Tragic 6.1% |
| Ottawa | 0.1 /100 | #259 | Tragic 6.1% |