Immigrants from Burma/Myanmar vs Czechoslovakian Unemployment Among Seniors over 75 years
COMPARE
Immigrants from Burma/Myanmar
Czechoslovakian
Unemployment Among Seniors over 75 years
Unemployment Among Seniors over 75 years Comparison
Immigrants from Burma/Myanmar
Czechoslovakians
7.7%
UNEMPLOYMENT AMONG SENIORS OVER 75 YEARS
100.0/ 100
METRIC RATING
41st/ 347
METRIC RANK
9.4%
UNEMPLOYMENT AMONG SENIORS OVER 75 YEARS
0.3/ 100
METRIC RATING
273rd/ 347
METRIC RANK
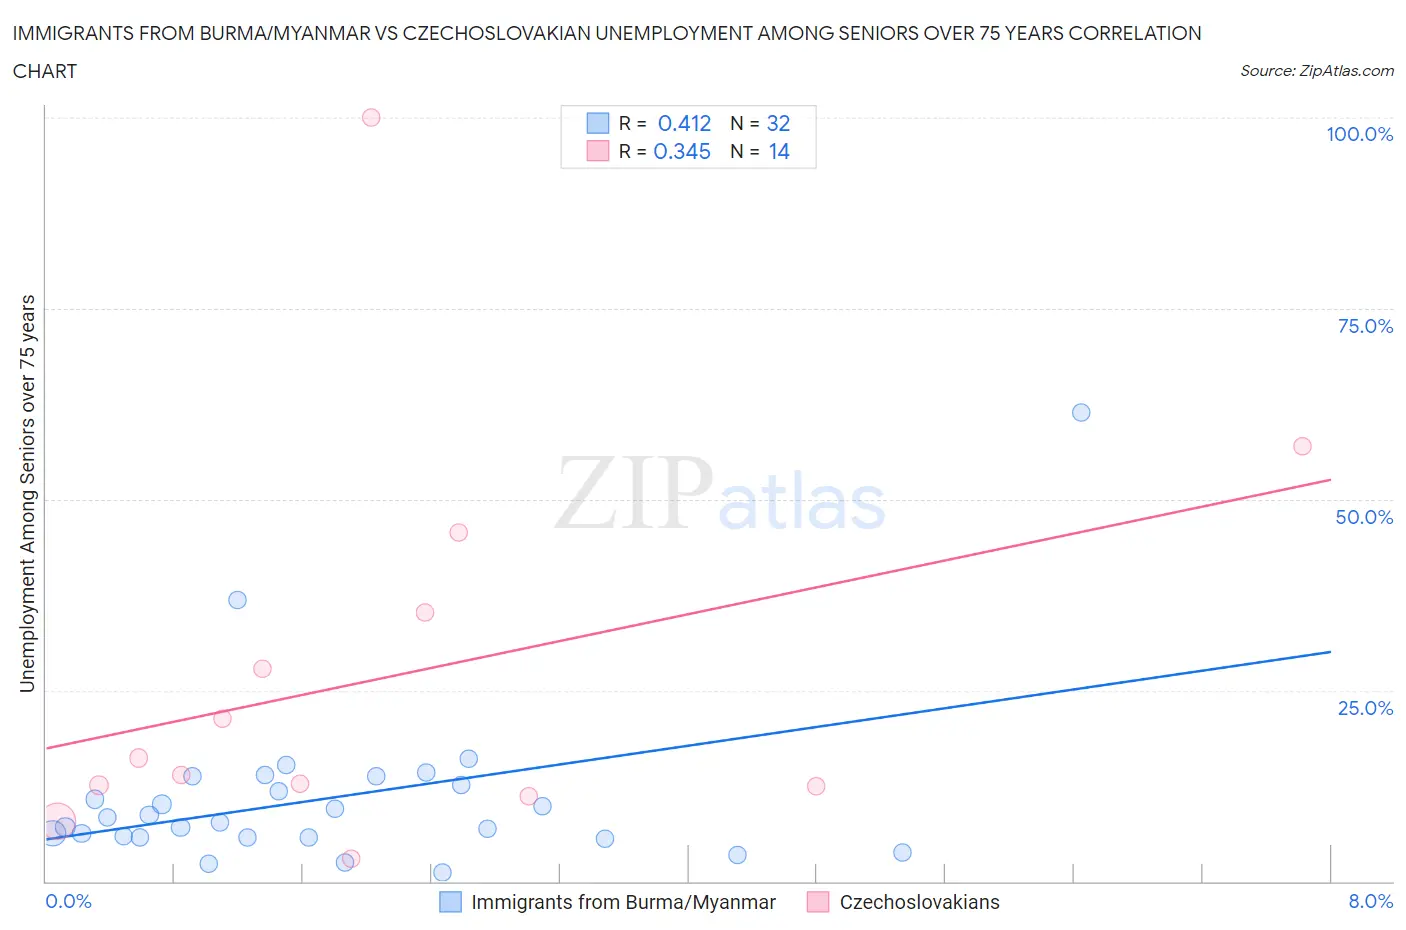
Immigrants from Burma/Myanmar vs Czechoslovakian Unemployment Among Seniors over 75 years Correlation Chart
The statistical analysis conducted on geographies consisting of 114,707,279 people shows a moderate positive correlation between the proportion of Immigrants from Burma/Myanmar and unemployment rate among seniors over the age of 75 in the United States with a correlation coefficient (R) of 0.412 and weighted average of 7.7%. Similarly, the statistical analysis conducted on geographies consisting of 187,754,654 people shows a mild positive correlation between the proportion of Czechoslovakians and unemployment rate among seniors over the age of 75 in the United States with a correlation coefficient (R) of 0.345 and weighted average of 9.4%, a difference of 22.3%.
Unemployment Among Seniors over 75 years Correlation Summary
| Measurement | Immigrants from Burma/Myanmar | Czechoslovakian |
| Minimum | 1.1% | 2.9% |
| Maximum | 61.4% | 100.0% |
| Range | 60.3% | 97.1% |
| Mean | 10.9% | 26.9% |
| Median | 8.1% | 15.0% |
| Interquartile 25% (IQ1) | 5.7% | 12.5% |
| Interquartile 75% (IQ3) | 13.2% | 35.2% |
| Interquartile Range (IQR) | 7.5% | 22.7% |
| Standard Deviation (Sample) | 11.2% | 26.0% |
| Standard Deviation (Population) | 11.0% | 25.0% |
Similar Demographics by Unemployment Among Seniors over 75 years
Demographics Similar to Immigrants from Burma/Myanmar by Unemployment Among Seniors over 75 years
In terms of unemployment among seniors over 75 years, the demographic groups most similar to Immigrants from Burma/Myanmar are Colville (7.7%, a difference of 0.13%), Ugandan (7.7%, a difference of 0.16%), Kiowa (7.7%, a difference of 0.20%), Immigrants from Hungary (7.7%, a difference of 0.21%), and Pueblo (7.7%, a difference of 0.23%).
| Demographics | Rating | Rank | Unemployment Among Seniors over 75 years |
| Immigrants | Eritrea | 100.0 /100 | #34 | Exceptional 7.7% |
| Immigrants | Norway | 100.0 /100 | #35 | Exceptional 7.7% |
| Luxembourgers | 100.0 /100 | #36 | Exceptional 7.7% |
| Immigrants | Hungary | 100.0 /100 | #37 | Exceptional 7.7% |
| Kiowa | 100.0 /100 | #38 | Exceptional 7.7% |
| Ugandans | 100.0 /100 | #39 | Exceptional 7.7% |
| Colville | 100.0 /100 | #40 | Exceptional 7.7% |
| Immigrants | Burma/Myanmar | 100.0 /100 | #41 | Exceptional 7.7% |
| Pueblo | 100.0 /100 | #42 | Exceptional 7.7% |
| Immigrants | Denmark | 100.0 /100 | #43 | Exceptional 7.8% |
| Immigrants | Spain | 100.0 /100 | #44 | Exceptional 7.8% |
| British West Indians | 100.0 /100 | #45 | Exceptional 7.8% |
| Immigrants | China | 100.0 /100 | #46 | Exceptional 7.8% |
| Creek | 100.0 /100 | #47 | Exceptional 7.8% |
| Immigrants | Chile | 100.0 /100 | #48 | Exceptional 7.8% |
Demographics Similar to Czechoslovakians by Unemployment Among Seniors over 75 years
In terms of unemployment among seniors over 75 years, the demographic groups most similar to Czechoslovakians are Jamaican (9.5%, a difference of 0.12%), Immigrants from Iraq (9.4%, a difference of 0.14%), Bulgarian (9.4%, a difference of 0.17%), Yaqui (9.4%, a difference of 0.25%), and Senegalese (9.5%, a difference of 0.32%).
| Demographics | Rating | Rank | Unemployment Among Seniors over 75 years |
| Blacks/African Americans | 0.5 /100 | #266 | Tragic 9.4% |
| Immigrants | Mexico | 0.4 /100 | #267 | Tragic 9.4% |
| Greeks | 0.4 /100 | #268 | Tragic 9.4% |
| Puerto Ricans | 0.3 /100 | #269 | Tragic 9.4% |
| Yaqui | 0.3 /100 | #270 | Tragic 9.4% |
| Bulgarians | 0.3 /100 | #271 | Tragic 9.4% |
| Immigrants | Iraq | 0.3 /100 | #272 | Tragic 9.4% |
| Czechoslovakians | 0.3 /100 | #273 | Tragic 9.4% |
| Jamaicans | 0.2 /100 | #274 | Tragic 9.5% |
| Senegalese | 0.2 /100 | #275 | Tragic 9.5% |
| Arabs | 0.2 /100 | #276 | Tragic 9.5% |
| Swiss | 0.1 /100 | #277 | Tragic 9.5% |
| Immigrants | Senegal | 0.1 /100 | #278 | Tragic 9.6% |
| British | 0.1 /100 | #279 | Tragic 9.6% |
| Croatians | 0.1 /100 | #280 | Tragic 9.6% |