Immigrants from Brazil vs Peruvian Male Unemployment
COMPARE
Immigrants from Brazil
Peruvian
Male Unemployment
Male Unemployment Comparison
Immigrants from Brazil
Peruvians
5.2%
MALE UNEMPLOYMENT
86.3/ 100
METRIC RATING
127th/ 347
METRIC RANK
5.3%
MALE UNEMPLOYMENT
51.9/ 100
METRIC RATING
171st/ 347
METRIC RANK
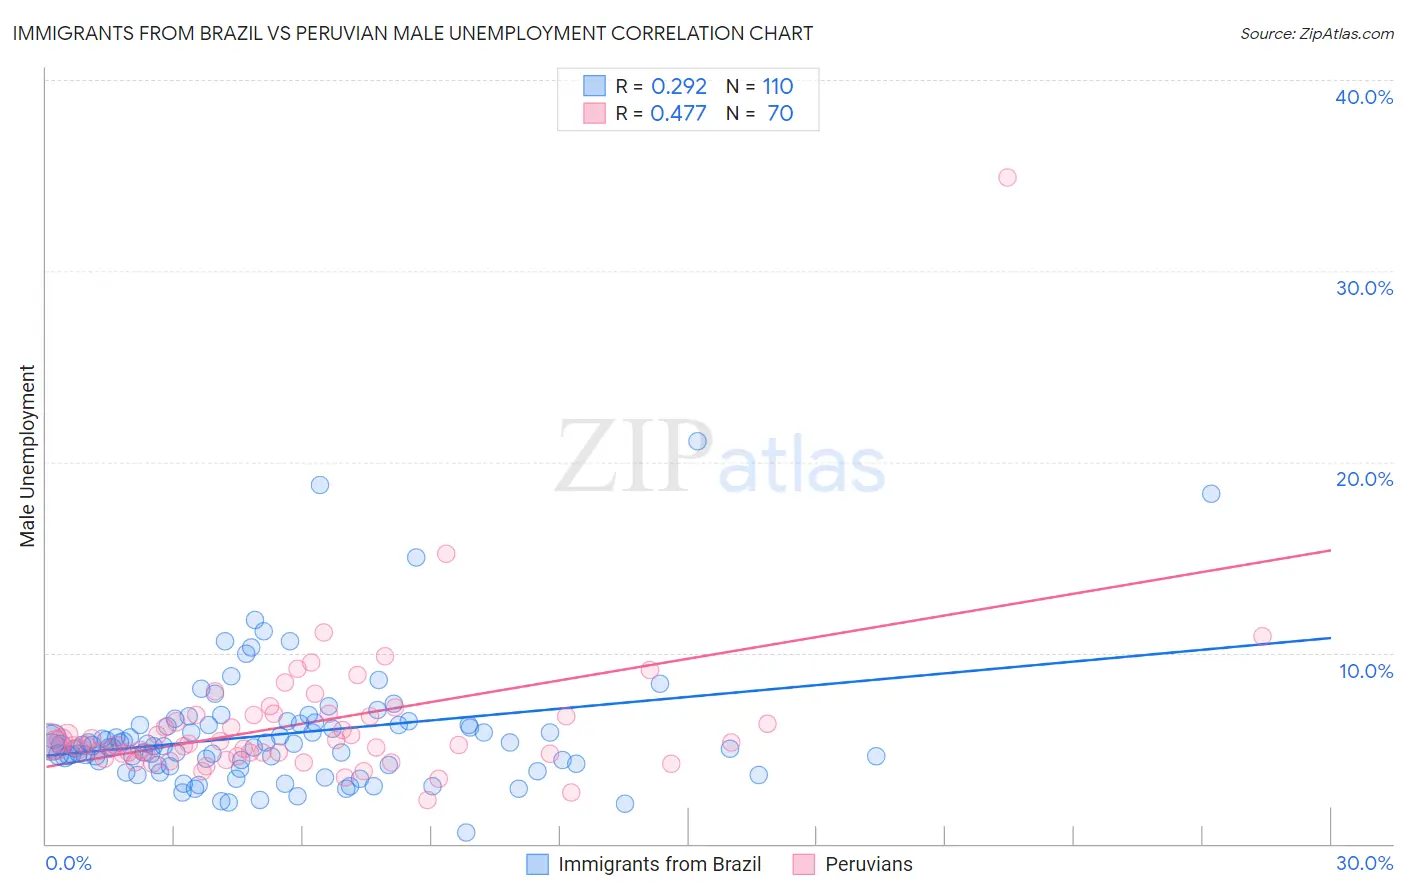
Immigrants from Brazil vs Peruvian Male Unemployment Correlation Chart
The statistical analysis conducted on geographies consisting of 342,068,748 people shows a weak positive correlation between the proportion of Immigrants from Brazil and unemployment rate among males in the United States with a correlation coefficient (R) of 0.292 and weighted average of 5.2%. Similarly, the statistical analysis conducted on geographies consisting of 362,248,150 people shows a moderate positive correlation between the proportion of Peruvians and unemployment rate among males in the United States with a correlation coefficient (R) of 0.477 and weighted average of 5.3%, a difference of 2.6%.
Male Unemployment Correlation Summary
| Measurement | Immigrants from Brazil | Peruvian |
| Minimum | 0.60% | 2.3% |
| Maximum | 21.1% | 34.9% |
| Range | 20.5% | 32.6% |
| Mean | 5.7% | 6.3% |
| Median | 5.1% | 5.2% |
| Interquartile 25% (IQ1) | 4.1% | 4.7% |
| Interquartile 75% (IQ3) | 6.2% | 6.7% |
| Interquartile Range (IQR) | 2.1% | 2.0% |
| Standard Deviation (Sample) | 3.2% | 4.1% |
| Standard Deviation (Population) | 3.2% | 4.0% |
Similar Demographics by Male Unemployment
Demographics Similar to Immigrants from Brazil by Male Unemployment
In terms of male unemployment, the demographic groups most similar to Immigrants from Brazil are Immigrants from Colombia (5.1%, a difference of 0.060%), Immigrants from Lithuania (5.1%, a difference of 0.11%), Immigrants from Latvia (5.1%, a difference of 0.15%), Hungarian (5.2%, a difference of 0.15%), and Palestinian (5.1%, a difference of 0.18%).
| Demographics | Rating | Rank | Male Unemployment |
| Ukrainians | 88.4 /100 | #120 | Excellent 5.1% |
| Mongolians | 88.4 /100 | #121 | Excellent 5.1% |
| Nicaraguans | 88.2 /100 | #122 | Excellent 5.1% |
| Palestinians | 87.7 /100 | #123 | Excellent 5.1% |
| Immigrants | Latvia | 87.5 /100 | #124 | Excellent 5.1% |
| Immigrants | Lithuania | 87.2 /100 | #125 | Excellent 5.1% |
| Immigrants | Colombia | 86.8 /100 | #126 | Excellent 5.1% |
| Immigrants | Brazil | 86.3 /100 | #127 | Excellent 5.2% |
| Hungarians | 85.1 /100 | #128 | Excellent 5.2% |
| Immigrants | Western Europe | 84.8 /100 | #129 | Excellent 5.2% |
| Immigrants | Malaysia | 83.5 /100 | #130 | Excellent 5.2% |
| Immigrants | Germany | 83.0 /100 | #131 | Excellent 5.2% |
| Chickasaw | 82.9 /100 | #132 | Excellent 5.2% |
| Colombians | 81.1 /100 | #133 | Excellent 5.2% |
| Pakistanis | 80.5 /100 | #134 | Excellent 5.2% |
Demographics Similar to Peruvians by Male Unemployment
In terms of male unemployment, the demographic groups most similar to Peruvians are Immigrants from Kazakhstan (5.3%, a difference of 0.060%), Immigrants from Russia (5.3%, a difference of 0.070%), Immigrants from Iran (5.3%, a difference of 0.11%), Immigrants from Eastern Europe (5.3%, a difference of 0.13%), and Immigrants from Iraq (5.3%, a difference of 0.22%).
| Demographics | Rating | Rank | Male Unemployment |
| Afghans | 62.0 /100 | #164 | Good 5.3% |
| South Americans | 60.6 /100 | #165 | Good 5.3% |
| Immigrants | Morocco | 60.2 /100 | #166 | Good 5.3% |
| Immigrants | Vietnam | 58.1 /100 | #167 | Average 5.3% |
| Immigrants | Ireland | 57.7 /100 | #168 | Average 5.3% |
| Immigrants | Congo | 57.4 /100 | #169 | Average 5.3% |
| Immigrants | Eastern Europe | 54.1 /100 | #170 | Average 5.3% |
| Peruvians | 51.9 /100 | #171 | Average 5.3% |
| Immigrants | Kazakhstan | 50.8 /100 | #172 | Average 5.3% |
| Immigrants | Russia | 50.7 /100 | #173 | Average 5.3% |
| Immigrants | Iran | 50.0 /100 | #174 | Average 5.3% |
| Immigrants | Iraq | 48.1 /100 | #175 | Average 5.3% |
| Immigrants | Poland | 46.0 /100 | #176 | Average 5.3% |
| Immigrants | Peru | 44.6 /100 | #177 | Average 5.3% |
| Osage | 42.5 /100 | #178 | Average 5.3% |