Immigrants from Brazil vs Navajo Male Unemployment
COMPARE
Immigrants from Brazil
Navajo
Male Unemployment
Male Unemployment Comparison
Immigrants from Brazil
Navajo
5.2%
MALE UNEMPLOYMENT
86.3/ 100
METRIC RATING
127th/ 347
METRIC RANK
9.8%
MALE UNEMPLOYMENT
0.0/ 100
METRIC RATING
341st/ 347
METRIC RANK
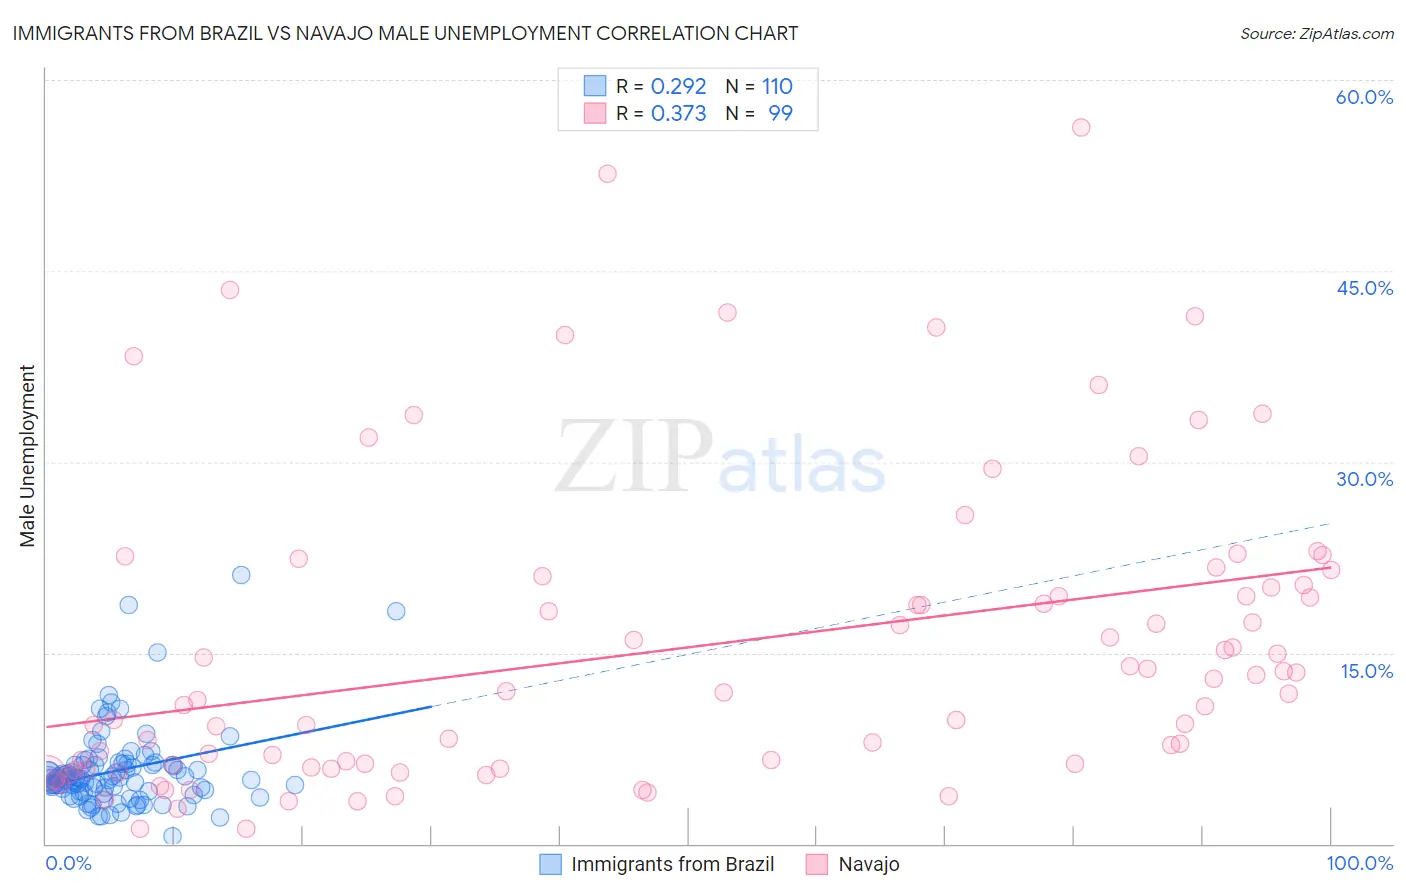
Immigrants from Brazil vs Navajo Male Unemployment Correlation Chart
The statistical analysis conducted on geographies consisting of 342,068,748 people shows a weak positive correlation between the proportion of Immigrants from Brazil and unemployment rate among males in the United States with a correlation coefficient (R) of 0.292 and weighted average of 5.2%. Similarly, the statistical analysis conducted on geographies consisting of 223,979,709 people shows a mild positive correlation between the proportion of Navajo and unemployment rate among males in the United States with a correlation coefficient (R) of 0.373 and weighted average of 9.8%, a difference of 90.8%.
Male Unemployment Correlation Summary
| Measurement | Immigrants from Brazil | Navajo |
| Minimum | 0.60% | 1.2% |
| Maximum | 21.1% | 56.3% |
| Range | 20.5% | 55.1% |
| Mean | 5.7% | 15.4% |
| Median | 5.1% | 11.9% |
| Interquartile 25% (IQ1) | 4.1% | 6.0% |
| Interquartile 75% (IQ3) | 6.2% | 20.4% |
| Interquartile Range (IQR) | 2.1% | 14.4% |
| Standard Deviation (Sample) | 3.2% | 12.0% |
| Standard Deviation (Population) | 3.2% | 11.9% |
Similar Demographics by Male Unemployment
Demographics Similar to Immigrants from Brazil by Male Unemployment
In terms of male unemployment, the demographic groups most similar to Immigrants from Brazil are Immigrants from Colombia (5.1%, a difference of 0.060%), Immigrants from Lithuania (5.1%, a difference of 0.11%), Immigrants from Latvia (5.1%, a difference of 0.15%), Hungarian (5.2%, a difference of 0.15%), and Palestinian (5.1%, a difference of 0.18%).
| Demographics | Rating | Rank | Male Unemployment |
| Ukrainians | 88.4 /100 | #120 | Excellent 5.1% |
| Mongolians | 88.4 /100 | #121 | Excellent 5.1% |
| Nicaraguans | 88.2 /100 | #122 | Excellent 5.1% |
| Palestinians | 87.7 /100 | #123 | Excellent 5.1% |
| Immigrants | Latvia | 87.5 /100 | #124 | Excellent 5.1% |
| Immigrants | Lithuania | 87.2 /100 | #125 | Excellent 5.1% |
| Immigrants | Colombia | 86.8 /100 | #126 | Excellent 5.1% |
| Immigrants | Brazil | 86.3 /100 | #127 | Excellent 5.2% |
| Hungarians | 85.1 /100 | #128 | Excellent 5.2% |
| Immigrants | Western Europe | 84.8 /100 | #129 | Excellent 5.2% |
| Immigrants | Malaysia | 83.5 /100 | #130 | Excellent 5.2% |
| Immigrants | Germany | 83.0 /100 | #131 | Excellent 5.2% |
| Chickasaw | 82.9 /100 | #132 | Excellent 5.2% |
| Colombians | 81.1 /100 | #133 | Excellent 5.2% |
| Pakistanis | 80.5 /100 | #134 | Excellent 5.2% |
Demographics Similar to Navajo by Male Unemployment
In terms of male unemployment, the demographic groups most similar to Navajo are Alaskan Athabascan (9.8%, a difference of 0.28%), Cheyenne (9.8%, a difference of 0.36%), Tohono O'odham (10.2%, a difference of 3.4%), Crow (10.6%, a difference of 7.9%), and Hopi (10.8%, a difference of 9.7%).
| Demographics | Rating | Rank | Male Unemployment |
| Sioux | 0.0 /100 | #333 | Tragic 8.4% |
| Tsimshian | 0.0 /100 | #334 | Tragic 8.5% |
| Pueblo | 0.0 /100 | #335 | Tragic 8.5% |
| Yuman | 0.0 /100 | #336 | Tragic 8.6% |
| Puerto Ricans | 0.0 /100 | #337 | Tragic 8.6% |
| Apache | 0.0 /100 | #338 | Tragic 8.6% |
| Cheyenne | 0.0 /100 | #339 | Tragic 9.8% |
| Alaskan Athabascans | 0.0 /100 | #340 | Tragic 9.8% |
| Navajo | 0.0 /100 | #341 | Tragic 9.8% |
| Tohono O'odham | 0.0 /100 | #342 | Tragic 10.2% |
| Crow | 0.0 /100 | #343 | Tragic 10.6% |
| Hopi | 0.0 /100 | #344 | Tragic 10.8% |
| Arapaho | 0.0 /100 | #345 | Tragic 11.0% |
| Inupiat | 0.0 /100 | #346 | Tragic 12.1% |
| Yup'ik | 0.0 /100 | #347 | Tragic 16.4% |