Immigrants from Belize vs Immigrants from Denmark Unemployment Among Women with Children Under 6 years
COMPARE
Immigrants from Belize
Immigrants from Denmark
Unemployment Among Women with Children Under 6 years
Unemployment Among Women with Children Under 6 years Comparison
Immigrants from Belize
Immigrants from Denmark
8.6%
UNEMPLOYMENT AMONG WOMEN WITH CHILDREN UNDER 6 YEARS
0.0/ 100
METRIC RATING
280th/ 347
METRIC RANK
7.1%
UNEMPLOYMENT AMONG WOMEN WITH CHILDREN UNDER 6 YEARS
98.3/ 100
METRIC RATING
89th/ 347
METRIC RANK
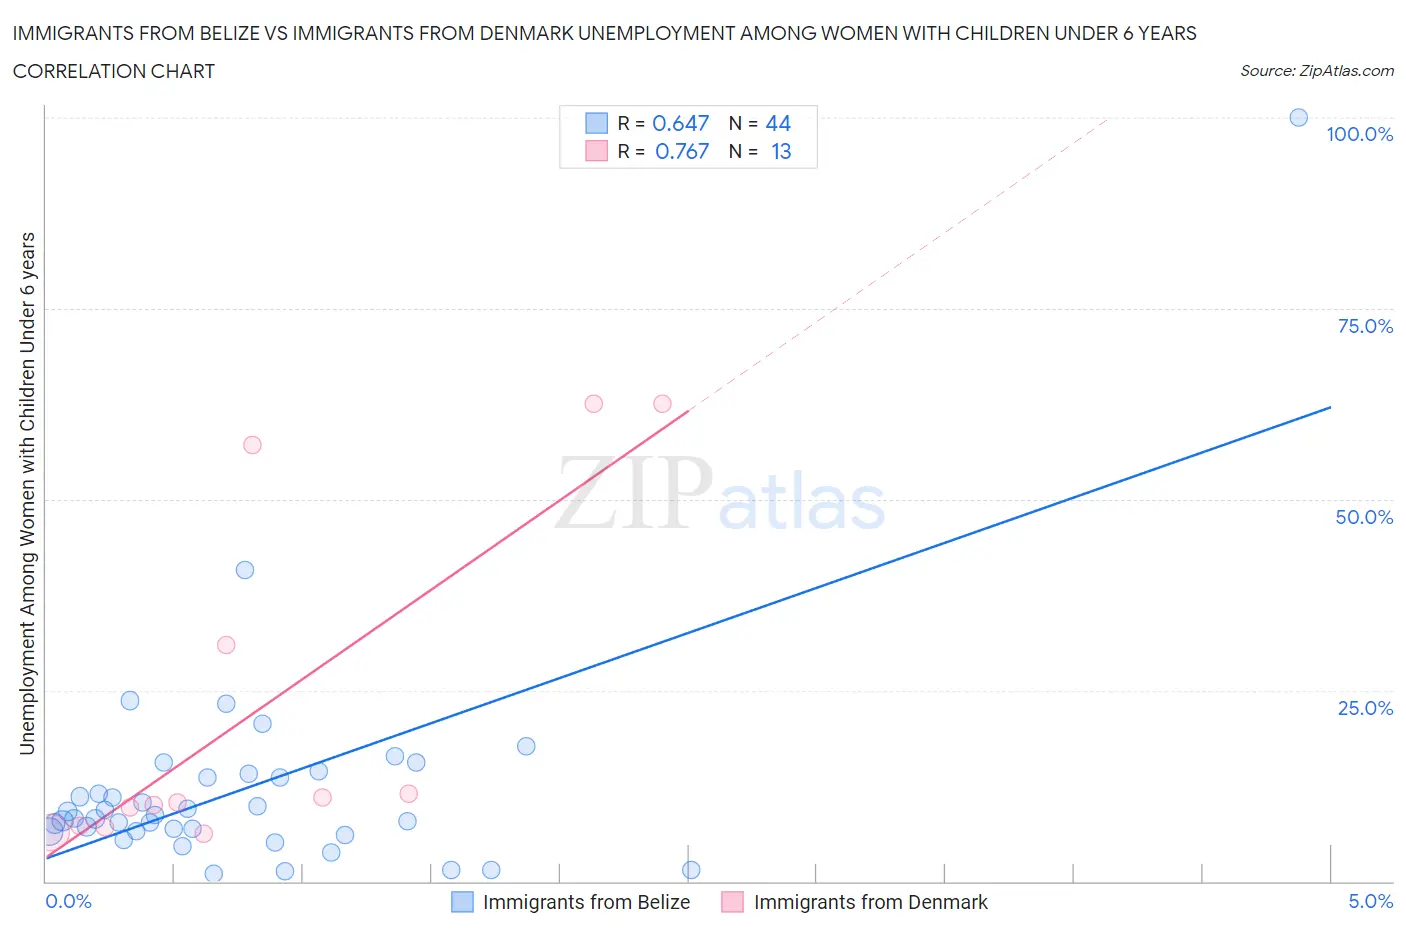
Immigrants from Belize vs Immigrants from Denmark Unemployment Among Women with Children Under 6 years Correlation Chart
The statistical analysis conducted on geographies consisting of 116,794,257 people shows a significant positive correlation between the proportion of Immigrants from Belize and unemployment rate among women with children under the age of 6 in the United States with a correlation coefficient (R) of 0.647 and weighted average of 8.6%. Similarly, the statistical analysis conducted on geographies consisting of 117,608,008 people shows a strong positive correlation between the proportion of Immigrants from Denmark and unemployment rate among women with children under the age of 6 in the United States with a correlation coefficient (R) of 0.767 and weighted average of 7.1%, a difference of 21.2%.
Unemployment Among Women with Children Under 6 years Correlation Summary
| Measurement | Immigrants from Belize | Immigrants from Denmark |
| Minimum | 1.0% | 6.3% |
| Maximum | 100.0% | 62.5% |
| Range | 99.0% | 56.2% |
| Mean | 12.3% | 22.5% |
| Median | 8.5% | 10.3% |
| Interquartile 25% (IQ1) | 6.6% | 7.2% |
| Interquartile 75% (IQ3) | 13.9% | 44.0% |
| Interquartile Range (IQR) | 7.3% | 36.8% |
| Standard Deviation (Sample) | 15.3% | 22.7% |
| Standard Deviation (Population) | 15.2% | 21.8% |
Similar Demographics by Unemployment Among Women with Children Under 6 years
Demographics Similar to Immigrants from Belize by Unemployment Among Women with Children Under 6 years
In terms of unemployment among women with children under 6 years, the demographic groups most similar to Immigrants from Belize are Immigrants from Guatemala (8.6%, a difference of 0.040%), Immigrants from Dominica (8.6%, a difference of 0.050%), Guatemalan (8.7%, a difference of 0.14%), Bermudan (8.7%, a difference of 0.23%), and Spanish American Indian (8.7%, a difference of 0.25%).
| Demographics | Rating | Rank | Unemployment Among Women with Children Under 6 years |
| Slovaks | 0.1 /100 | #273 | Tragic 8.5% |
| Immigrants | Cameroon | 0.1 /100 | #274 | Tragic 8.6% |
| Immigrants | Latin America | 0.1 /100 | #275 | Tragic 8.6% |
| Yaqui | 0.0 /100 | #276 | Tragic 8.6% |
| Haitians | 0.0 /100 | #277 | Tragic 8.6% |
| Immigrants | Dominica | 0.0 /100 | #278 | Tragic 8.6% |
| Immigrants | Guatemala | 0.0 /100 | #279 | Tragic 8.6% |
| Immigrants | Belize | 0.0 /100 | #280 | Tragic 8.6% |
| Guatemalans | 0.0 /100 | #281 | Tragic 8.7% |
| Bermudans | 0.0 /100 | #282 | Tragic 8.7% |
| Spanish American Indians | 0.0 /100 | #283 | Tragic 8.7% |
| Blackfeet | 0.0 /100 | #284 | Tragic 8.7% |
| U.S. Virgin Islanders | 0.0 /100 | #285 | Tragic 8.7% |
| Seminole | 0.0 /100 | #286 | Tragic 8.7% |
| Menominee | 0.0 /100 | #287 | Tragic 8.7% |
Demographics Similar to Immigrants from Denmark by Unemployment Among Women with Children Under 6 years
In terms of unemployment among women with children under 6 years, the demographic groups most similar to Immigrants from Denmark are Immigrants from Hungary (7.1%, a difference of 0.040%), Immigrants from Spain (7.1%, a difference of 0.050%), Danish (7.1%, a difference of 0.12%), Alsatian (7.1%, a difference of 0.16%), and Albanian (7.2%, a difference of 0.25%).
| Demographics | Rating | Rank | Unemployment Among Women with Children Under 6 years |
| Immigrants | Afghanistan | 98.7 /100 | #82 | Exceptional 7.1% |
| Egyptians | 98.7 /100 | #83 | Exceptional 7.1% |
| Immigrants | Albania | 98.7 /100 | #84 | Exceptional 7.1% |
| Immigrants | Romania | 98.7 /100 | #85 | Exceptional 7.1% |
| Immigrants | Zimbabwe | 98.6 /100 | #86 | Exceptional 7.1% |
| Alsatians | 98.4 /100 | #87 | Exceptional 7.1% |
| Immigrants | Hungary | 98.3 /100 | #88 | Exceptional 7.1% |
| Immigrants | Denmark | 98.3 /100 | #89 | Exceptional 7.1% |
| Immigrants | Spain | 98.2 /100 | #90 | Exceptional 7.1% |
| Danes | 98.2 /100 | #91 | Exceptional 7.1% |
| Albanians | 98.0 /100 | #92 | Exceptional 7.2% |
| New Zealanders | 97.8 /100 | #93 | Exceptional 7.2% |
| Macedonians | 97.7 /100 | #94 | Exceptional 7.2% |
| Romanians | 97.7 /100 | #95 | Exceptional 7.2% |
| Immigrants | Eastern Africa | 97.7 /100 | #96 | Exceptional 7.2% |