Immigrants from Belarus vs Immigrants from Denmark Unemployment Among Women with Children Under 6 years
COMPARE
Immigrants from Belarus
Immigrants from Denmark
Unemployment Among Women with Children Under 6 years
Unemployment Among Women with Children Under 6 years Comparison
Immigrants from Belarus
Immigrants from Denmark
6.6%
UNEMPLOYMENT AMONG WOMEN WITH CHILDREN UNDER 6 YEARS
100.0/ 100
METRIC RATING
30th/ 347
METRIC RANK
7.1%
UNEMPLOYMENT AMONG WOMEN WITH CHILDREN UNDER 6 YEARS
98.3/ 100
METRIC RATING
89th/ 347
METRIC RANK
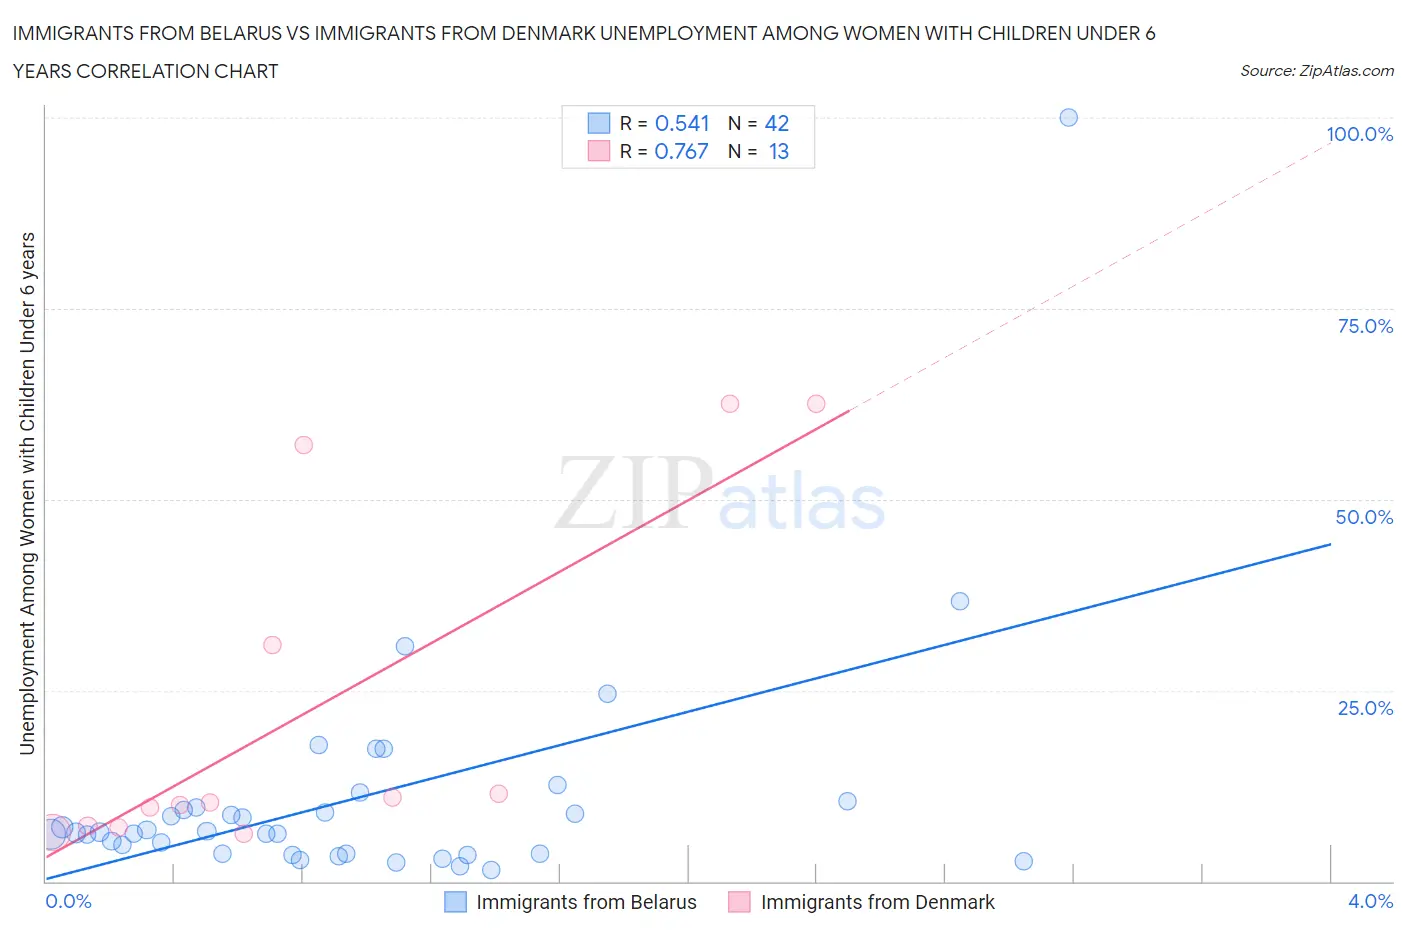
Immigrants from Belarus vs Immigrants from Denmark Unemployment Among Women with Children Under 6 years Correlation Chart
The statistical analysis conducted on geographies consisting of 129,688,046 people shows a substantial positive correlation between the proportion of Immigrants from Belarus and unemployment rate among women with children under the age of 6 in the United States with a correlation coefficient (R) of 0.541 and weighted average of 6.6%. Similarly, the statistical analysis conducted on geographies consisting of 117,608,008 people shows a strong positive correlation between the proportion of Immigrants from Denmark and unemployment rate among women with children under the age of 6 in the United States with a correlation coefficient (R) of 0.767 and weighted average of 7.1%, a difference of 8.4%.
Unemployment Among Women with Children Under 6 years Correlation Summary
| Measurement | Immigrants from Belarus | Immigrants from Denmark |
| Minimum | 1.5% | 6.3% |
| Maximum | 100.0% | 62.5% |
| Range | 98.5% | 56.2% |
| Mean | 10.9% | 22.5% |
| Median | 6.4% | 10.3% |
| Interquartile 25% (IQ1) | 3.6% | 7.2% |
| Interquartile 75% (IQ3) | 9.7% | 44.0% |
| Interquartile Range (IQR) | 6.1% | 36.8% |
| Standard Deviation (Sample) | 15.9% | 22.7% |
| Standard Deviation (Population) | 15.7% | 21.8% |
Similar Demographics by Unemployment Among Women with Children Under 6 years
Demographics Similar to Immigrants from Belarus by Unemployment Among Women with Children Under 6 years
In terms of unemployment among women with children under 6 years, the demographic groups most similar to Immigrants from Belarus are Immigrants from Moldova (6.6%, a difference of 0.29%), Immigrants from Sweden (6.6%, a difference of 0.32%), Tsimshian (6.6%, a difference of 0.36%), Immigrants from Vietnam (6.6%, a difference of 0.38%), and Immigrants from South Central Asia (6.6%, a difference of 0.38%).
| Demographics | Rating | Rank | Unemployment Among Women with Children Under 6 years |
| Bulgarians | 100.0 /100 | #23 | Exceptional 6.5% |
| Laotians | 100.0 /100 | #24 | Exceptional 6.5% |
| Soviet Union | 100.0 /100 | #25 | Exceptional 6.5% |
| Cypriots | 100.0 /100 | #26 | Exceptional 6.5% |
| Immigrants | Japan | 100.0 /100 | #27 | Exceptional 6.5% |
| Immigrants | Israel | 100.0 /100 | #28 | Exceptional 6.5% |
| Immigrants | Sweden | 100.0 /100 | #29 | Exceptional 6.6% |
| Immigrants | Belarus | 100.0 /100 | #30 | Exceptional 6.6% |
| Immigrants | Moldova | 100.0 /100 | #31 | Exceptional 6.6% |
| Tsimshian | 100.0 /100 | #32 | Exceptional 6.6% |
| Immigrants | Vietnam | 100.0 /100 | #33 | Exceptional 6.6% |
| Immigrants | South Central Asia | 100.0 /100 | #34 | Exceptional 6.6% |
| Yakama | 100.0 /100 | #35 | Exceptional 6.6% |
| Luxembourgers | 100.0 /100 | #36 | Exceptional 6.6% |
| Sri Lankans | 100.0 /100 | #37 | Exceptional 6.6% |
Demographics Similar to Immigrants from Denmark by Unemployment Among Women with Children Under 6 years
In terms of unemployment among women with children under 6 years, the demographic groups most similar to Immigrants from Denmark are Immigrants from Hungary (7.1%, a difference of 0.040%), Immigrants from Spain (7.1%, a difference of 0.050%), Danish (7.1%, a difference of 0.12%), Alsatian (7.1%, a difference of 0.16%), and Albanian (7.2%, a difference of 0.25%).
| Demographics | Rating | Rank | Unemployment Among Women with Children Under 6 years |
| Immigrants | Afghanistan | 98.7 /100 | #82 | Exceptional 7.1% |
| Egyptians | 98.7 /100 | #83 | Exceptional 7.1% |
| Immigrants | Albania | 98.7 /100 | #84 | Exceptional 7.1% |
| Immigrants | Romania | 98.7 /100 | #85 | Exceptional 7.1% |
| Immigrants | Zimbabwe | 98.6 /100 | #86 | Exceptional 7.1% |
| Alsatians | 98.4 /100 | #87 | Exceptional 7.1% |
| Immigrants | Hungary | 98.3 /100 | #88 | Exceptional 7.1% |
| Immigrants | Denmark | 98.3 /100 | #89 | Exceptional 7.1% |
| Immigrants | Spain | 98.2 /100 | #90 | Exceptional 7.1% |
| Danes | 98.2 /100 | #91 | Exceptional 7.1% |
| Albanians | 98.0 /100 | #92 | Exceptional 7.2% |
| New Zealanders | 97.8 /100 | #93 | Exceptional 7.2% |
| Macedonians | 97.7 /100 | #94 | Exceptional 7.2% |
| Romanians | 97.7 /100 | #95 | Exceptional 7.2% |
| Immigrants | Eastern Africa | 97.7 /100 | #96 | Exceptional 7.2% |