Immigrants from Bangladesh vs Uruguayan Unemployment Among Ages 16 to 19 years
COMPARE
Immigrants from Bangladesh
Uruguayan
Unemployment Among Ages 16 to 19 years
Unemployment Among Ages 16 to 19 years Comparison
Immigrants from Bangladesh
Uruguayans
21.5%
UNEMPLOYMENT AMONG AGES 16 TO 19 YEARS
0.0/ 100
METRIC RATING
308th/ 347
METRIC RANK
17.5%
UNEMPLOYMENT AMONG AGES 16 TO 19 YEARS
64.3/ 100
METRIC RATING
157th/ 347
METRIC RANK
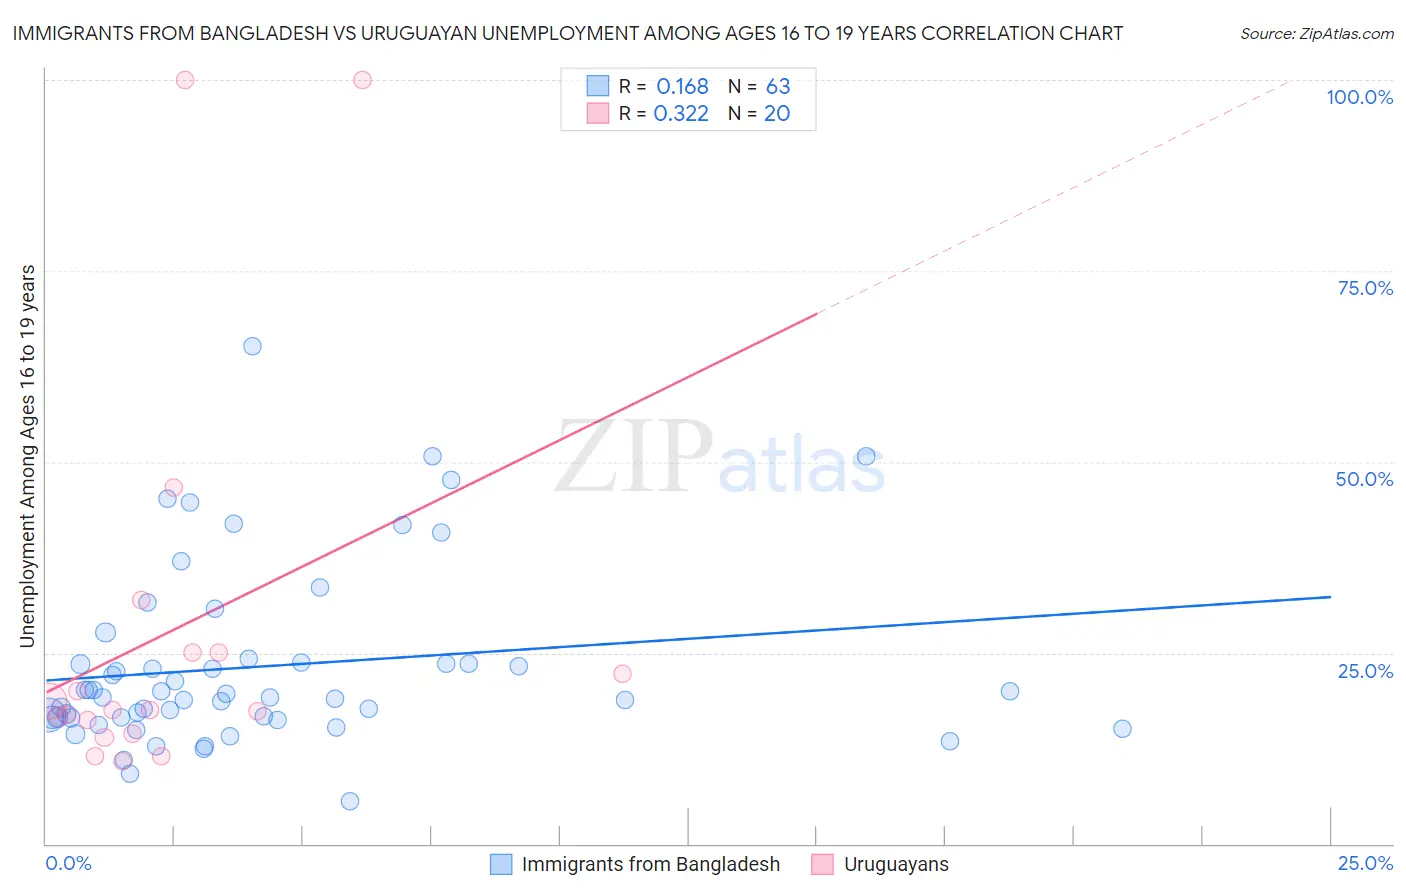
Immigrants from Bangladesh vs Uruguayan Unemployment Among Ages 16 to 19 years Correlation Chart
The statistical analysis conducted on geographies consisting of 198,385,806 people shows a poor positive correlation between the proportion of Immigrants from Bangladesh and unemployment rate among population between the ages 16 and 19 in the United States with a correlation coefficient (R) of 0.168 and weighted average of 21.5%. Similarly, the statistical analysis conducted on geographies consisting of 141,401,091 people shows a mild positive correlation between the proportion of Uruguayans and unemployment rate among population between the ages 16 and 19 in the United States with a correlation coefficient (R) of 0.322 and weighted average of 17.5%, a difference of 23.1%.
Unemployment Among Ages 16 to 19 years Correlation Summary
| Measurement | Immigrants from Bangladesh | Uruguayan |
| Minimum | 5.5% | 10.8% |
| Maximum | 65.1% | 100.0% |
| Range | 59.6% | 89.2% |
| Mean | 23.2% | 27.7% |
| Median | 19.2% | 17.5% |
| Interquartile 25% (IQ1) | 16.5% | 15.3% |
| Interquartile 75% (IQ3) | 23.8% | 25.0% |
| Interquartile Range (IQR) | 7.3% | 9.7% |
| Standard Deviation (Sample) | 11.7% | 26.0% |
| Standard Deviation (Population) | 11.6% | 25.4% |
Similar Demographics by Unemployment Among Ages 16 to 19 years
Demographics Similar to Immigrants from Bangladesh by Unemployment Among Ages 16 to 19 years
In terms of unemployment among ages 16 to 19 years, the demographic groups most similar to Immigrants from Bangladesh are Native/Alaskan (21.5%, a difference of 0.16%), Vietnamese (21.5%, a difference of 0.22%), Black/African American (21.4%, a difference of 0.38%), Belizean (21.6%, a difference of 0.44%), and Houma (21.6%, a difference of 0.70%).
| Demographics | Rating | Rank | Unemployment Among Ages 16 to 19 years |
| Immigrants | Ecuador | 0.0 /100 | #301 | Tragic 20.9% |
| Immigrants | Caribbean | 0.0 /100 | #302 | Tragic 20.9% |
| Senegalese | 0.0 /100 | #303 | Tragic 21.0% |
| Aleuts | 0.0 /100 | #304 | Tragic 21.2% |
| Immigrants | Senegal | 0.0 /100 | #305 | Tragic 21.2% |
| U.S. Virgin Islanders | 0.0 /100 | #306 | Tragic 21.3% |
| Blacks/African Americans | 0.0 /100 | #307 | Tragic 21.4% |
| Immigrants | Bangladesh | 0.0 /100 | #308 | Tragic 21.5% |
| Natives/Alaskans | 0.0 /100 | #309 | Tragic 21.5% |
| Vietnamese | 0.0 /100 | #310 | Tragic 21.5% |
| Belizeans | 0.0 /100 | #311 | Tragic 21.6% |
| Houma | 0.0 /100 | #312 | Tragic 21.6% |
| Jamaicans | 0.0 /100 | #313 | Tragic 21.7% |
| Alaska Natives | 0.0 /100 | #314 | Tragic 21.8% |
| Immigrants | Dominica | 0.0 /100 | #315 | Tragic 21.9% |
Demographics Similar to Uruguayans by Unemployment Among Ages 16 to 19 years
In terms of unemployment among ages 16 to 19 years, the demographic groups most similar to Uruguayans are Immigrants from China (17.5%, a difference of 0.010%), Costa Rican (17.4%, a difference of 0.080%), Portuguese (17.4%, a difference of 0.16%), Korean (17.5%, a difference of 0.17%), and Ukrainian (17.5%, a difference of 0.19%).
| Demographics | Rating | Rank | Unemployment Among Ages 16 to 19 years |
| Immigrants | Northern Europe | 72.5 /100 | #150 | Good 17.4% |
| Immigrants | Hong Kong | 69.3 /100 | #151 | Good 17.4% |
| Immigrants | Northern Africa | 69.0 /100 | #152 | Good 17.4% |
| Immigrants | Afghanistan | 68.6 /100 | #153 | Good 17.4% |
| Afghans | 68.1 /100 | #154 | Good 17.4% |
| Portuguese | 67.3 /100 | #155 | Good 17.4% |
| Costa Ricans | 65.9 /100 | #156 | Good 17.4% |
| Uruguayans | 64.3 /100 | #157 | Good 17.5% |
| Immigrants | China | 64.1 /100 | #158 | Good 17.5% |
| Koreans | 61.0 /100 | #159 | Good 17.5% |
| Ukrainians | 60.5 /100 | #160 | Good 17.5% |
| Immigrants | Denmark | 60.3 /100 | #161 | Good 17.5% |
| Immigrants | Norway | 59.8 /100 | #162 | Average 17.5% |
| Egyptians | 59.7 /100 | #163 | Average 17.5% |
| Immigrants | Austria | 57.7 /100 | #164 | Average 17.5% |