Alaskan Athabascan vs Uruguayan Unemployment Among Ages 16 to 19 years
COMPARE
Alaskan Athabascan
Uruguayan
Unemployment Among Ages 16 to 19 years
Unemployment Among Ages 16 to 19 years Comparison
Alaskan Athabascans
Uruguayans
17.7%
UNEMPLOYMENT AMONG AGES 16 TO 19 YEARS
34.1/ 100
METRIC RATING
196th/ 347
METRIC RANK
17.5%
UNEMPLOYMENT AMONG AGES 16 TO 19 YEARS
64.3/ 100
METRIC RATING
157th/ 347
METRIC RANK
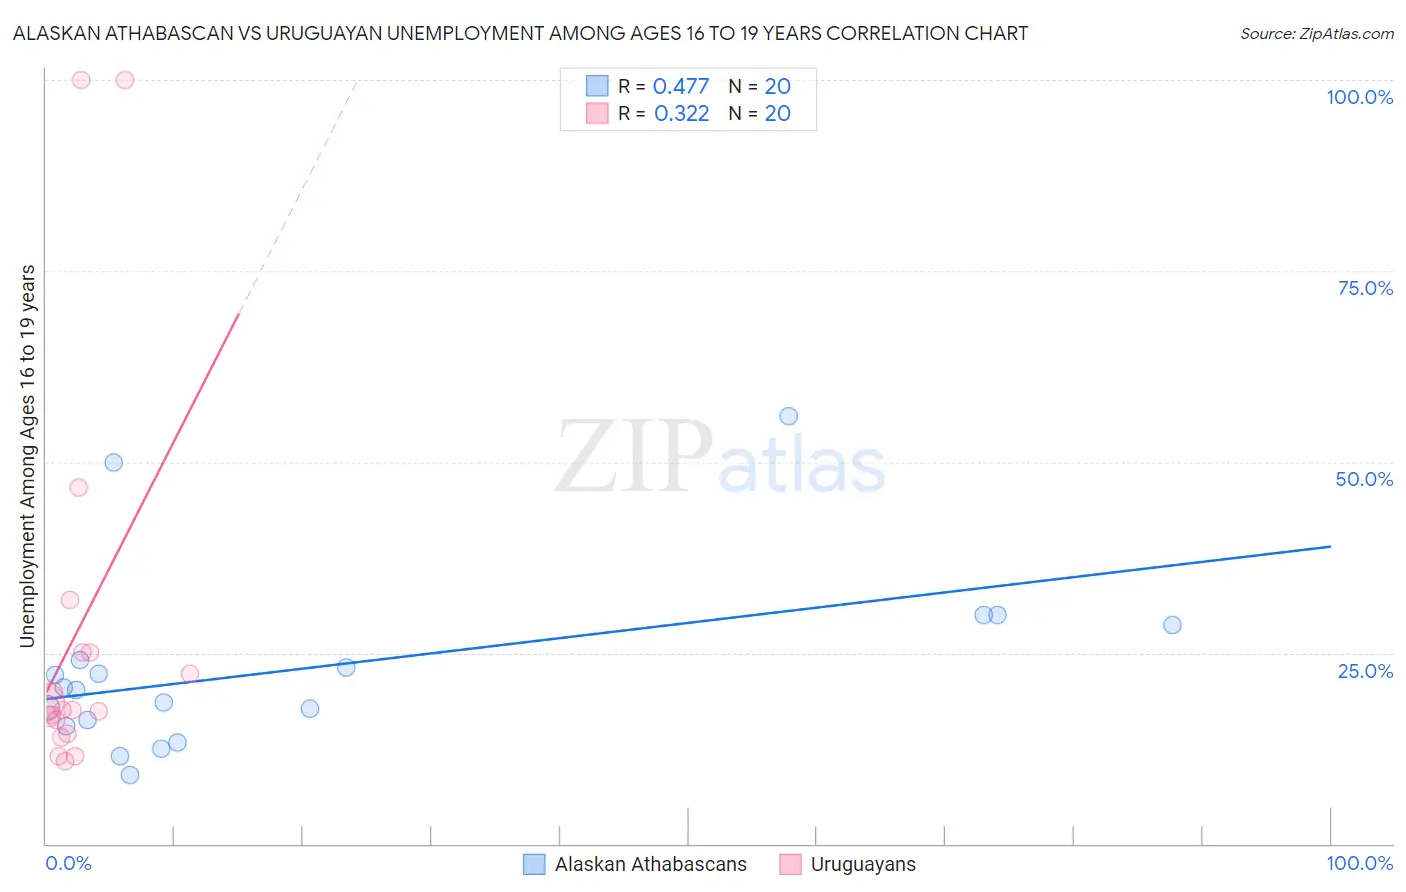
Alaskan Athabascan vs Uruguayan Unemployment Among Ages 16 to 19 years Correlation Chart
The statistical analysis conducted on geographies consisting of 45,046,237 people shows a moderate positive correlation between the proportion of Alaskan Athabascans and unemployment rate among population between the ages 16 and 19 in the United States with a correlation coefficient (R) of 0.477 and weighted average of 17.7%. Similarly, the statistical analysis conducted on geographies consisting of 141,401,091 people shows a mild positive correlation between the proportion of Uruguayans and unemployment rate among population between the ages 16 and 19 in the United States with a correlation coefficient (R) of 0.322 and weighted average of 17.5%, a difference of 1.5%.
Unemployment Among Ages 16 to 19 years Correlation Summary
| Measurement | Alaskan Athabascan | Uruguayan |
| Minimum | 9.0% | 10.8% |
| Maximum | 56.0% | 100.0% |
| Range | 47.0% | 89.2% |
| Mean | 22.9% | 27.7% |
| Median | 20.2% | 17.5% |
| Interquartile 25% (IQ1) | 15.9% | 15.3% |
| Interquartile 75% (IQ3) | 26.4% | 25.0% |
| Interquartile Range (IQR) | 10.5% | 9.7% |
| Standard Deviation (Sample) | 11.9% | 26.0% |
| Standard Deviation (Population) | 11.6% | 25.4% |
Similar Demographics by Unemployment Among Ages 16 to 19 years
Demographics Similar to Alaskan Athabascans by Unemployment Among Ages 16 to 19 years
In terms of unemployment among ages 16 to 19 years, the demographic groups most similar to Alaskan Athabascans are Immigrants from Peru (17.7%, a difference of 0.16%), Immigrants from Czechoslovakia (17.8%, a difference of 0.23%), Peruvian (17.7%, a difference of 0.24%), Ethiopian (17.8%, a difference of 0.24%), and Immigrants from Ireland (17.8%, a difference of 0.30%).
| Demographics | Rating | Rank | Unemployment Among Ages 16 to 19 years |
| Immigrants | Europe | 41.8 /100 | #189 | Average 17.6% |
| Marshallese | 41.7 /100 | #190 | Average 17.6% |
| Immigrants | Costa Rica | 41.3 /100 | #191 | Average 17.6% |
| Immigrants | Philippines | 40.7 /100 | #192 | Average 17.7% |
| Immigrants | Australia | 40.6 /100 | #193 | Average 17.7% |
| Peruvians | 38.8 /100 | #194 | Fair 17.7% |
| Immigrants | Peru | 37.3 /100 | #195 | Fair 17.7% |
| Alaskan Athabascans | 34.1 /100 | #196 | Fair 17.7% |
| Immigrants | Czechoslovakia | 29.8 /100 | #197 | Fair 17.8% |
| Ethiopians | 29.6 /100 | #198 | Fair 17.8% |
| Immigrants | Ireland | 28.5 /100 | #199 | Fair 17.8% |
| Immigrants | Fiji | 27.7 /100 | #200 | Fair 17.8% |
| Immigrants | Ethiopia | 27.4 /100 | #201 | Fair 17.8% |
| Immigrants | Portugal | 27.2 /100 | #202 | Fair 17.8% |
| Immigrants | Eastern Europe | 23.6 /100 | #203 | Fair 17.8% |
Demographics Similar to Uruguayans by Unemployment Among Ages 16 to 19 years
In terms of unemployment among ages 16 to 19 years, the demographic groups most similar to Uruguayans are Immigrants from China (17.5%, a difference of 0.010%), Costa Rican (17.4%, a difference of 0.080%), Portuguese (17.4%, a difference of 0.16%), Korean (17.5%, a difference of 0.17%), and Ukrainian (17.5%, a difference of 0.19%).
| Demographics | Rating | Rank | Unemployment Among Ages 16 to 19 years |
| Immigrants | Northern Europe | 72.5 /100 | #150 | Good 17.4% |
| Immigrants | Hong Kong | 69.3 /100 | #151 | Good 17.4% |
| Immigrants | Northern Africa | 69.0 /100 | #152 | Good 17.4% |
| Immigrants | Afghanistan | 68.6 /100 | #153 | Good 17.4% |
| Afghans | 68.1 /100 | #154 | Good 17.4% |
| Portuguese | 67.3 /100 | #155 | Good 17.4% |
| Costa Ricans | 65.9 /100 | #156 | Good 17.4% |
| Uruguayans | 64.3 /100 | #157 | Good 17.5% |
| Immigrants | China | 64.1 /100 | #158 | Good 17.5% |
| Koreans | 61.0 /100 | #159 | Good 17.5% |
| Ukrainians | 60.5 /100 | #160 | Good 17.5% |
| Immigrants | Denmark | 60.3 /100 | #161 | Good 17.5% |
| Immigrants | Norway | 59.8 /100 | #162 | Average 17.5% |
| Egyptians | 59.7 /100 | #163 | Average 17.5% |
| Immigrants | Austria | 57.7 /100 | #164 | Average 17.5% |