Immigrants from Australia vs Venezuelan Unemployment Among Women with Children Under 18 years

COMPARE

Immigrants from Australia
Race
Ancestry
AfghanAfricanAlaska NativeAlaskan AthabascanAlbanianAleutAlsatianAmericanApacheArabArapahoArgentineanArmenianAssyrian/Chaldean/SyriacAustralianAustrianBahamianBangladeshiBarbadianBasqueBelgianBelizeanBermudanBhutaneseBlackfeetBolivianBrazilianBritishBritish West IndianBulgarianBurmeseCajunCambodianCanadianCape VerdeanCarpatho RusynCelticCentral AmericanCentral American IndianCherokeeCheyenneChickasawChileanChineseChippewaChoctawColombianColvilleComancheCosta RicanCreeCreekCroatianCrowCubanCypriotCzechCzechoslovakianDanishDelawareDominicanDutchDutch West IndianEastern EuropeanEcuadorianEgyptianEnglishEstonianEthiopianEuropeanFijianFilipinoFinnishFrenchFrench American IndianFrench CanadianGermanGerman RussianGhanaianGreekGuamanian/ChamorroGuatemalanGuyaneseHaitianHmongHonduranHopiHoumaHungarianIcelanderIndian (Asian)IndonesianInupiatIranianIraqiIrishIroquoisIsraeliItalianJamaicanJapaneseJordanianKenyanKiowaKoreanLaotianLatvianLebaneseLiberianLithuanianLumbeeLuxembourgerMacedonianMalaysianMalteseMarshalleseMenomineeMexicanMexican American IndianMongolianMoroccanNative HawaiianNavajoNepaleseNew ZealanderNicaraguanNigerianNorthern EuropeanNorwegianOkinawanOsageOttawaPaiutePakistaniPalestinianPanamanianParaguayanPennsylvania GermanPeruvianPimaPolishPortuguesePotawatomiPuebloPuerto RicanPuget Sound SalishRomanianRussianSalvadoranSamoanScandinavianScotch-IrishScottishSeminoleSenegaleseSerbianShoshoneSierra LeoneanSiouxSlavicSlovakSloveneSomaliSouth AfricanSouth AmericanSouth American IndianSoviet UnionSpaniardSpanishSpanish AmericanSpanish American IndianSri LankanSubsaharan AfricanSudaneseSwedishSwissSyrianTaiwaneseThaiTlingit-HaidaTohono O'OdhamTonganTrinidadian and TobagonianTsimshianTurkishU.S. Virgin IslanderUgandanUkrainianUruguayanUteVietnameseWelshWest IndianYakamaYaquiYugoslavianYumanYup'ikZimbabwean
Immigration
NonimmigrantsImmigrantsAfghanistanAfricaAlbaniaArgentinaArmeniaAsiaAustraliaAustriaBahamasBangladeshBarbadosBelarusBelgiumBelizeBoliviaBosnia and HerzegovinaBrazilBulgariaBurma/MyanmarCabo VerdeCambodiaCameroonCanadaCaribbeanCentral AmericaChileChinaColombiaCongoCosta RicaCroatiaCubaCzechoslovakiaDenmarkDominicaDominican RepublicEastern AfricaEastern AsiaEastern EuropeEcuadorEgyptEl SalvadorEnglandEritreaEthiopiaEuropeFijiFranceGermanyGhanaGreeceGrenadaGuatemalaGuyanaHaitiHondurasHong KongHungaryIndiaIndonesiaIranIraqIrelandIsraelItalyJamaicaJapanJordanKazakhstanKenyaKoreaKuwaitLaosLatin AmericaLatviaLebanonLiberiaLithuaniaMalaysiaMexicoMicronesiaMiddle AfricaMoldovaMoroccoNepalNetherlandsNicaraguaNigeriaNorth AmericaNorth MacedoniaNorthern AfricaNorthern EuropeNorwayOceaniaPakistanPanamaPeruPhilippinesPolandPortugalRomaniaRussiaSaudi ArabiaScotlandSenegalSerbiaSierra LeoneSingaporeSomaliaSouth AfricaSouth AmericaSouth Central AsiaSouth Eastern AsiaSouthern EuropeSpainSri LankaSt. Vincent and the GrenadinesSudanSwedenSwitzerlandSyriaTaiwanThailandTrinidad and TobagoTurkeyUgandaUkraineUruguayUzbekistanVenezuelaVietnamWest IndiesWestern AfricaWestern AsiaWestern EuropeYemenZaireZimbabweAzores
Venezuelan
Race
Ancestry
AfghanAfricanAlaska NativeAlaskan AthabascanAlbanianAleutAlsatianAmericanApacheArabArapahoArgentineanArmenianAssyrian/Chaldean/SyriacAustralianAustrianBahamianBangladeshiBarbadianBasqueBelgianBelizeanBermudanBhutaneseBlackfeetBolivianBrazilianBritishBritish West IndianBulgarianBurmeseCajunCambodianCanadianCape VerdeanCarpatho RusynCelticCentral AmericanCentral American IndianCherokeeCheyenneChickasawChileanChineseChippewaChoctawColombianColvilleComancheCosta RicanCreeCreekCroatianCrowCubanCypriotCzechCzechoslovakianDanishDelawareDominicanDutchDutch West IndianEastern EuropeanEcuadorianEgyptianEnglishEstonianEthiopianEuropeanFijianFilipinoFinnishFrenchFrench American IndianFrench CanadianGermanGerman RussianGhanaianGreekGuamanian/ChamorroGuatemalanGuyaneseHaitianHmongHonduranHopiHoumaHungarianIcelanderIndian (Asian)IndonesianInupiatIranianIraqiIrishIroquoisIsraeliItalianJamaicanJapaneseJordanianKenyanKiowaKoreanLaotianLatvianLebaneseLiberianLithuanianLumbeeLuxembourgerMacedonianMalaysianMalteseMarshalleseMenomineeMexicanMexican American IndianMongolianMoroccanNative HawaiianNavajoNepaleseNew ZealanderNicaraguanNigerianNorthern EuropeanNorwegianOkinawanOsageOttawaPaiutePakistaniPalestinianPanamanianParaguayanPennsylvania GermanPeruvianPimaPolishPortuguesePotawatomiPuebloPuerto RicanPuget Sound SalishRomanianRussianSalvadoranSamoanScandinavianScotch-IrishScottishSeminoleSenegaleseSerbianShoshoneSierra LeoneanSiouxSlavicSlovakSloveneSomaliSouth AfricanSouth AmericanSouth American IndianSoviet UnionSpaniardSpanishSpanish AmericanSpanish American IndianSri LankanSubsaharan AfricanSudaneseSwedishSwissSyrianTaiwaneseThaiTlingit-HaidaTohono O'OdhamTonganTrinidadian and TobagonianTsimshianTurkishU.S. Virgin IslanderUgandanUkrainianUruguayanUteVenezuelanVietnameseWelshWest IndianYakamaYaquiYugoslavianYumanYup'ikZimbabwean
Immigration
NonimmigrantsImmigrantsAfghanistanAfricaAlbaniaArgentinaArmeniaAsiaAustriaBahamasBangladeshBarbadosBelarusBelgiumBelizeBoliviaBosnia and HerzegovinaBrazilBulgariaBurma/MyanmarCabo VerdeCambodiaCameroonCanadaCaribbeanCentral AmericaChileChinaColombiaCongoCosta RicaCroatiaCubaCzechoslovakiaDenmarkDominicaDominican RepublicEastern AfricaEastern AsiaEastern EuropeEcuadorEgyptEl SalvadorEnglandEritreaEthiopiaEuropeFijiFranceGermanyGhanaGreeceGrenadaGuatemalaGuyanaHaitiHondurasHong KongHungaryIndiaIndonesiaIranIraqIrelandIsraelItalyJamaicaJapanJordanKazakhstanKenyaKoreaKuwaitLaosLatin AmericaLatviaLebanonLiberiaLithuaniaMalaysiaMexicoMicronesiaMiddle AfricaMoldovaMoroccoNepalNetherlandsNicaraguaNigeriaNorth AmericaNorth MacedoniaNorthern AfricaNorthern EuropeNorwayOceaniaPakistanPanamaPeruPhilippinesPolandPortugalRomaniaRussiaSaudi ArabiaScotlandSenegalSerbiaSierra LeoneSingaporeSomaliaSouth AfricaSouth AmericaSouth Central AsiaSouth Eastern AsiaSouthern EuropeSpainSri LankaSt. Vincent and the GrenadinesSudanSwedenSwitzerlandSyriaTaiwanThailandTrinidad and TobagoTurkeyUgandaUkraineUruguayUzbekistanVenezuelaVietnamWest IndiesWestern AfricaWestern AsiaWestern EuropeYemenZaireZimbabweAzores
Unemployment Among Women with Children Under 18 years
Income
Poverty
Unemployment
Labor Participation
Family Structure
Vehicle Availability
Education Level
Disability

Unemployment Among Women with Children Under 18 years Comparison

Immigrants from Australia

Venezuelans

Exceptional
Good
5.1%
UNEMPLOYMENT AMONG WOMEN WITH CHILDREN UNDER 18 YEARS
97.0/ 100
METRIC RATING
66th/ 347
METRIC RANK
5.3%
UNEMPLOYMENT AMONG WOMEN WITH CHILDREN UNDER 18 YEARS
76.0/ 100
METRIC RATING
141st/ 347
METRIC RANK

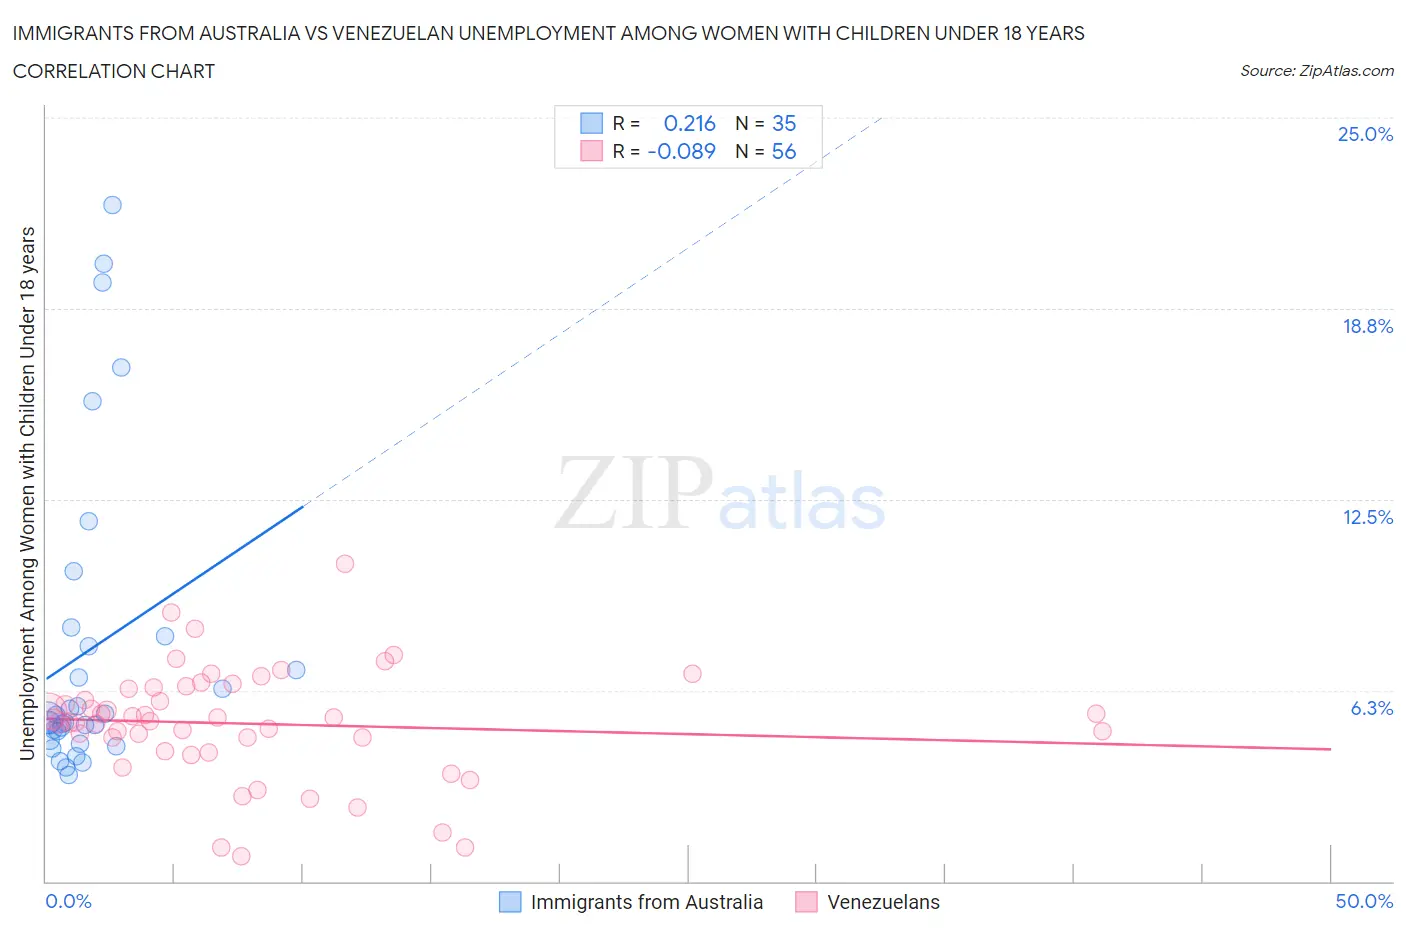
Immigrants from Australia vs Venezuelan Unemployment Among Women with Children Under 18 years Correlation Chart

The statistical analysis conducted on geographies consisting of 220,902,795 people shows a weak positive correlation between the proportion of Immigrants from Australia and unemployment rate among women with children under the age of 18 in the United States with a correlation coefficient (R) of 0.216 and weighted average of 5.1%. Similarly, the statistical analysis conducted on geographies consisting of 298,794,110 people shows a slight negative correlation between the proportion of Venezuelans and unemployment rate among women with children under the age of 18 in the United States with a correlation coefficient (R) of -0.089 and weighted average of 5.3%, a difference of 4.4%.
Immigrants from Australia vs Venezuelan Unemployment Among Women with Children Under 18 years

Unemployment Among Women with Children Under 18 years Correlation Summary

MeasurementImmigrants from AustraliaVenezuelan
Minimum3.5%0.80%
Maximum22.1%10.4%
Range18.6%9.6%
Mean7.6%5.2%
Median5.4%5.3%
Interquartile 25% (IQ1)4.6%4.5%
Interquartile 75% (IQ3)8.0%6.3%
Interquartile Range (IQR)3.4%1.8%
Standard Deviation (Sample)5.1%1.8%
Standard Deviation (Population)5.0%1.8%

Similar Demographics by Unemployment Among Women with Children Under 18 years

Demographics Similar to Immigrants from Australia by Unemployment Among Women with Children Under 18 years

In terms of unemployment among women with children under 18 years, the demographic groups most similar to Immigrants from Australia are Fijian (5.1%, a difference of 0.020%), Immigrants from Sweden (5.1%, a difference of 0.10%), Irish (5.1%, a difference of 0.11%), Estonian (5.1%, a difference of 0.12%), and Austrian (5.1%, a difference of 0.25%).
DemographicsRating | RankUnemployment Among Women with Children Under 18 years
Asians
97.9
/100
|
#59
Exceptional
5.1%
Welsh
97.7
/100
|
#60
Exceptional
5.1%
Russians
97.5
/100
|
#61
Exceptional
5.1%
Immigrants | Bulgaria
97.4
/100
|
#62
Exceptional
5.1%
Italians
97.4
/100
|
#63
Exceptional
5.1%
Estonians
97.2
/100
|
#64
Exceptional
5.1%
Immigrants | Sweden
97.1
/100
|
#65
Exceptional
5.1%
Immigrants | Australia
97.0
/100
|
#66
Exceptional
5.1%
Fijians
96.9
/100
|
#67
Exceptional
5.1%
Irish
96.8
/100
|
#68
Exceptional
5.1%
Austrians
96.6
/100
|
#69
Exceptional
5.1%
Icelanders
96.6
/100
|
#70
Exceptional
5.1%
Serbians
96.5
/100
|
#71
Exceptional
5.1%
Immigrants | Bolivia
96.1
/100
|
#72
Exceptional
5.1%
Albanians
95.9
/100
|
#73
Exceptional
5.1%

Demographics Similar to Venezuelans by Unemployment Among Women with Children Under 18 years

In terms of unemployment among women with children under 18 years, the demographic groups most similar to Venezuelans are Immigrants from Norway (5.3%, a difference of 0.020%), Immigrants from Venezuela (5.3%, a difference of 0.060%), Chilean (5.3%, a difference of 0.10%), Immigrants from England (5.3%, a difference of 0.11%), and Immigrants from Egypt (5.3%, a difference of 0.20%).
DemographicsRating | RankUnemployment Among Women with Children Under 18 years
Slovaks
80.5
/100
|
#134
Excellent
5.3%
New Zealanders
79.9
/100
|
#135
Good
5.3%
Immigrants | Jordan
79.5
/100
|
#136
Good
5.3%
Jordanians
78.8
/100
|
#137
Good
5.3%
Argentineans
78.8
/100
|
#138
Good
5.3%
Immigrants | Ukraine
78.5
/100
|
#139
Good
5.3%
Immigrants | Norway
76.2
/100
|
#140
Good
5.3%
Venezuelans
76.0
/100
|
#141
Good
5.3%
Immigrants | Venezuela
75.4
/100
|
#142
Good
5.3%
Chileans
75.0
/100
|
#143
Good
5.3%
Immigrants | England
74.9
/100
|
#144
Good
5.3%
Immigrants | Egypt
74.0
/100
|
#145
Good
5.3%
Immigrants | Belarus
73.4
/100
|
#146
Good
5.3%
Bangladeshis
73.2
/100
|
#147
Good
5.3%
Immigrants | Western Europe
72.8
/100
|
#148
Good
5.4%