Immigrants from Australia vs Estonian Unemployment Among Women with Children Under 18 years
COMPARE
Immigrants from Australia
Estonian
Unemployment Among Women with Children Under 18 years
Unemployment Among Women with Children Under 18 years Comparison
Immigrants from Australia
Estonians
5.1%
UNEMPLOYMENT AMONG WOMEN WITH CHILDREN UNDER 18 YEARS
97.0/ 100
METRIC RATING
66th/ 347
METRIC RANK
5.1%
UNEMPLOYMENT AMONG WOMEN WITH CHILDREN UNDER 18 YEARS
97.2/ 100
METRIC RATING
64th/ 347
METRIC RANK
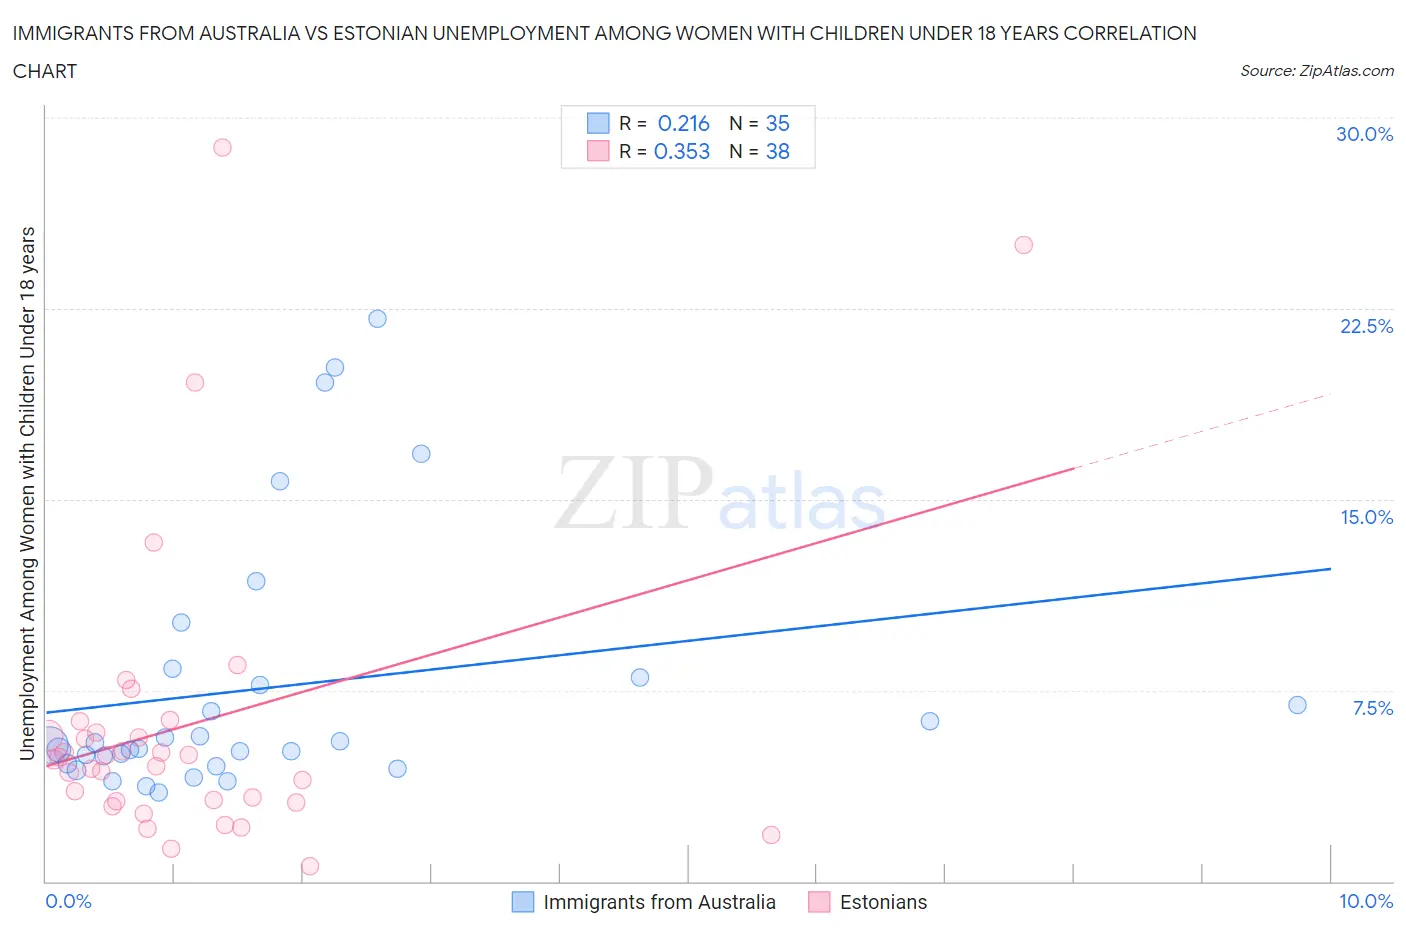
Immigrants from Australia vs Estonian Unemployment Among Women with Children Under 18 years Correlation Chart
The statistical analysis conducted on geographies consisting of 220,902,795 people shows a weak positive correlation between the proportion of Immigrants from Australia and unemployment rate among women with children under the age of 18 in the United States with a correlation coefficient (R) of 0.216 and weighted average of 5.1%. Similarly, the statistical analysis conducted on geographies consisting of 121,191,816 people shows a mild positive correlation between the proportion of Estonians and unemployment rate among women with children under the age of 18 in the United States with a correlation coefficient (R) of 0.353 and weighted average of 5.1%, a difference of 0.12%.
Unemployment Among Women with Children Under 18 years Correlation Summary
| Measurement | Immigrants from Australia | Estonian |
| Minimum | 3.5% | 0.60% |
| Maximum | 22.1% | 28.8% |
| Range | 18.6% | 28.2% |
| Mean | 7.6% | 6.2% |
| Median | 5.4% | 4.8% |
| Interquartile 25% (IQ1) | 4.6% | 3.2% |
| Interquartile 75% (IQ3) | 8.0% | 5.8% |
| Interquartile Range (IQR) | 3.4% | 2.7% |
| Standard Deviation (Sample) | 5.1% | 6.0% |
| Standard Deviation (Population) | 5.0% | 5.9% |
Demographics Similar to Immigrants from Australia and Estonians by Unemployment Among Women with Children Under 18 years
In terms of unemployment among women with children under 18 years, the demographic groups most similar to Immigrants from Australia are Fijian (5.1%, a difference of 0.020%), Immigrants from Sweden (5.1%, a difference of 0.10%), Irish (5.1%, a difference of 0.11%), Austrian (5.1%, a difference of 0.25%), and Icelander (5.1%, a difference of 0.25%). Similarly, the demographic groups most similar to Estonians are Immigrants from Sweden (5.1%, a difference of 0.020%), Fijian (5.1%, a difference of 0.14%), Italian (5.1%, a difference of 0.17%), Immigrants from Bulgaria (5.1%, a difference of 0.19%), and Irish (5.1%, a difference of 0.23%).
| Demographics | Rating | Rank | Unemployment Among Women with Children Under 18 years |
| Immigrants | Sri Lanka | 98.1 /100 | #55 | Exceptional 5.1% |
| Immigrants | Ireland | 98.0 /100 | #56 | Exceptional 5.1% |
| Czechoslovakians | 98.0 /100 | #57 | Exceptional 5.1% |
| Immigrants | Belgium | 97.9 /100 | #58 | Exceptional 5.1% |
| Asians | 97.9 /100 | #59 | Exceptional 5.1% |
| Welsh | 97.7 /100 | #60 | Exceptional 5.1% |
| Russians | 97.5 /100 | #61 | Exceptional 5.1% |
| Immigrants | Bulgaria | 97.4 /100 | #62 | Exceptional 5.1% |
| Italians | 97.4 /100 | #63 | Exceptional 5.1% |
| Estonians | 97.2 /100 | #64 | Exceptional 5.1% |
| Immigrants | Sweden | 97.1 /100 | #65 | Exceptional 5.1% |
| Immigrants | Australia | 97.0 /100 | #66 | Exceptional 5.1% |
| Fijians | 96.9 /100 | #67 | Exceptional 5.1% |
| Irish | 96.8 /100 | #68 | Exceptional 5.1% |
| Austrians | 96.6 /100 | #69 | Exceptional 5.1% |
| Icelanders | 96.6 /100 | #70 | Exceptional 5.1% |
| Serbians | 96.5 /100 | #71 | Exceptional 5.1% |
| Immigrants | Bolivia | 96.1 /100 | #72 | Exceptional 5.1% |
| Albanians | 95.9 /100 | #73 | Exceptional 5.1% |
| Immigrants | Northern Europe | 95.9 /100 | #74 | Exceptional 5.1% |
| Immigrants | Asia | 95.8 /100 | #75 | Exceptional 5.1% |