Immigrants from Australia vs Immigrants from Sudan Unemployment Among Women with Children Ages 6 to 17 years
COMPARE
Immigrants from Australia
Immigrants from Sudan
Unemployment Among Women with Children Ages 6 to 17 years
Unemployment Among Women with Children Ages 6 to 17 years Comparison
Immigrants from Australia
Immigrants from Sudan
8.3%
UNEMPLOYMENT AMONG WOMEN WITH CHILDREN AGES 6 TO 17 YEARS
99.8/ 100
METRIC RATING
71st/ 347
METRIC RANK
8.1%
UNEMPLOYMENT AMONG WOMEN WITH CHILDREN AGES 6 TO 17 YEARS
100.0/ 100
METRIC RATING
51st/ 347
METRIC RANK
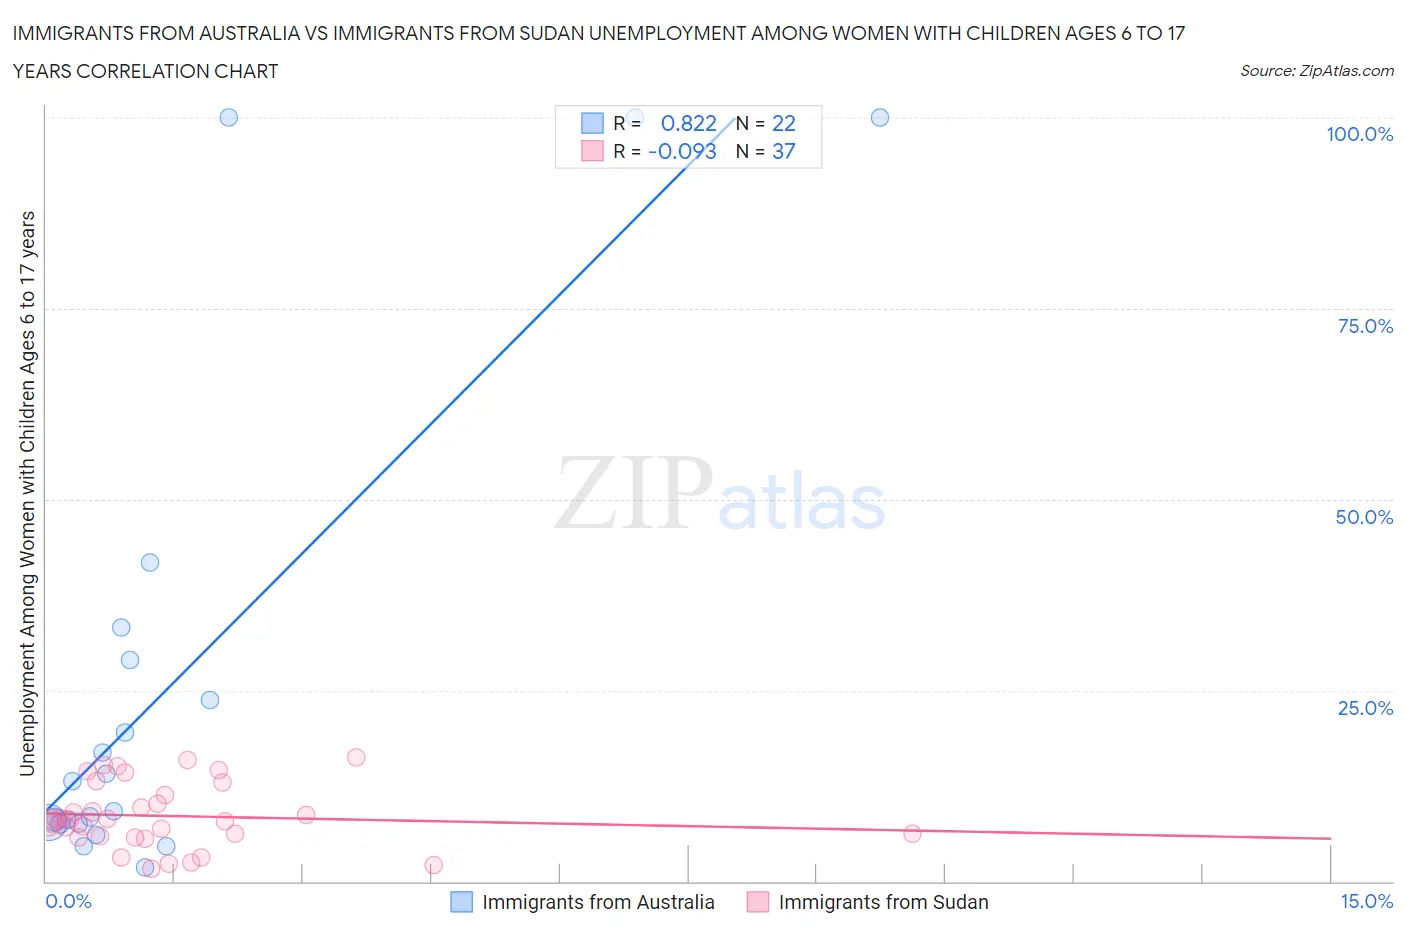
Immigrants from Australia vs Immigrants from Sudan Unemployment Among Women with Children Ages 6 to 17 years Correlation Chart
The statistical analysis conducted on geographies consisting of 174,255,035 people shows a very strong positive correlation between the proportion of Immigrants from Australia and unemployment rate among women with children between the ages 6 and 17 in the United States with a correlation coefficient (R) of 0.822 and weighted average of 8.3%. Similarly, the statistical analysis conducted on geographies consisting of 106,002,308 people shows a slight negative correlation between the proportion of Immigrants from Sudan and unemployment rate among women with children between the ages 6 and 17 in the United States with a correlation coefficient (R) of -0.093 and weighted average of 8.1%, a difference of 2.6%.
Unemployment Among Women with Children Ages 6 to 17 years Correlation Summary
| Measurement | Immigrants from Australia | Immigrants from Sudan |
| Minimum | 1.8% | 1.6% |
| Maximum | 100.0% | 16.2% |
| Range | 98.2% | 14.6% |
| Mean | 25.7% | 8.6% |
| Median | 11.2% | 8.0% |
| Interquartile 25% (IQ1) | 7.6% | 5.9% |
| Interquartile 75% (IQ3) | 29.0% | 12.1% |
| Interquartile Range (IQR) | 21.5% | 6.2% |
| Standard Deviation (Sample) | 31.9% | 4.2% |
| Standard Deviation (Population) | 31.1% | 4.1% |
Demographics Similar to Immigrants from Australia and Immigrants from Sudan by Unemployment Among Women with Children Ages 6 to 17 years
In terms of unemployment among women with children ages 6 to 17 years, the demographic groups most similar to Immigrants from Australia are Norwegian (8.3%, a difference of 0.060%), Immigrants from Thailand (8.3%, a difference of 0.15%), Marshallese (8.3%, a difference of 0.18%), Armenian (8.3%, a difference of 0.26%), and Luxembourger (8.3%, a difference of 0.36%). Similarly, the demographic groups most similar to Immigrants from Sudan are Immigrants from Iraq (8.1%, a difference of 0.30%), Danish (8.1%, a difference of 0.37%), Immigrants from Armenia (8.2%, a difference of 0.59%), Immigrants from Japan (8.2%, a difference of 0.65%), and Immigrants from Bosnia and Herzegovina (8.2%, a difference of 0.67%).
| Demographics | Rating | Rank | Unemployment Among Women with Children Ages 6 to 17 years |
| Immigrants | Sudan | 100.0 /100 | #51 | Exceptional 8.1% |
| Immigrants | Iraq | 100.0 /100 | #52 | Exceptional 8.1% |
| Danes | 100.0 /100 | #53 | Exceptional 8.1% |
| Immigrants | Armenia | 100.0 /100 | #54 | Exceptional 8.2% |
| Immigrants | Japan | 100.0 /100 | #55 | Exceptional 8.2% |
| Immigrants | Bosnia and Herzegovina | 100.0 /100 | #56 | Exceptional 8.2% |
| Immigrants | Laos | 100.0 /100 | #57 | Exceptional 8.2% |
| Immigrants | Malaysia | 100.0 /100 | #58 | Exceptional 8.2% |
| Immigrants | Philippines | 100.0 /100 | #59 | Exceptional 8.2% |
| Basques | 100.0 /100 | #60 | Exceptional 8.2% |
| Koreans | 100.0 /100 | #61 | Exceptional 8.2% |
| Spanish American Indians | 100.0 /100 | #62 | Exceptional 8.2% |
| Immigrants | South Eastern Asia | 99.9 /100 | #63 | Exceptional 8.2% |
| Immigrants | Kuwait | 99.9 /100 | #64 | Exceptional 8.3% |
| Immigrants | Albania | 99.9 /100 | #65 | Exceptional 8.3% |
| Luxembourgers | 99.9 /100 | #66 | Exceptional 8.3% |
| Armenians | 99.9 /100 | #67 | Exceptional 8.3% |
| Marshallese | 99.9 /100 | #68 | Exceptional 8.3% |
| Immigrants | Thailand | 99.9 /100 | #69 | Exceptional 8.3% |
| Norwegians | 99.9 /100 | #70 | Exceptional 8.3% |
| Immigrants | Australia | 99.8 /100 | #71 | Exceptional 8.3% |