Immigrants from Armenia vs Osage Unemployment Among Youth under 25 years
COMPARE
Immigrants from Armenia
Osage
Unemployment Among Youth under 25 years
Unemployment Among Youth under 25 years Comparison
Immigrants from Armenia
Osage
14.4%
UNEMPLOYMENT AMONG YOUTH UNDER 25 YEARS
0.0/ 100
METRIC RATING
313th/ 347
METRIC RANK
10.7%
UNEMPLOYMENT AMONG YOUTH UNDER 25 YEARS
99.9/ 100
METRIC RATING
30th/ 347
METRIC RANK
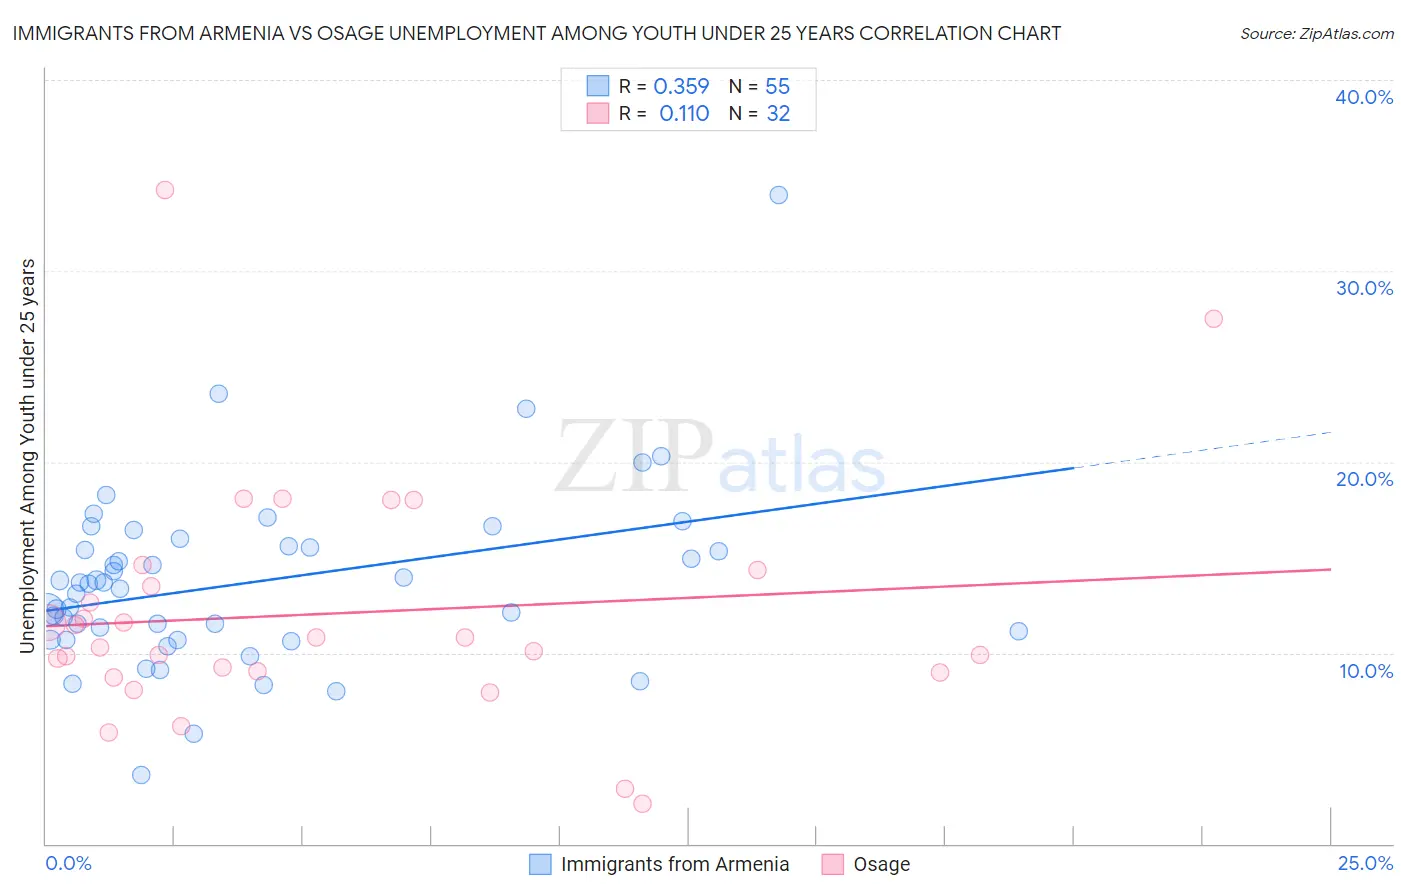
Immigrants from Armenia vs Osage Unemployment Among Youth under 25 years Correlation Chart
The statistical analysis conducted on geographies consisting of 97,450,391 people shows a mild positive correlation between the proportion of Immigrants from Armenia and unemployment rate among youth under the age of 25 in the United States with a correlation coefficient (R) of 0.359 and weighted average of 14.4%. Similarly, the statistical analysis conducted on geographies consisting of 91,372,569 people shows a poor positive correlation between the proportion of Osage and unemployment rate among youth under the age of 25 in the United States with a correlation coefficient (R) of 0.110 and weighted average of 10.7%, a difference of 34.1%.
Unemployment Among Youth under 25 years Correlation Summary
| Measurement | Immigrants from Armenia | Osage |
| Minimum | 3.6% | 2.1% |
| Maximum | 34.0% | 34.2% |
| Range | 30.4% | 32.1% |
| Mean | 13.7% | 12.1% |
| Median | 13.6% | 10.5% |
| Interquartile 25% (IQ1) | 10.7% | 9.0% |
| Interquartile 75% (IQ3) | 15.6% | 13.9% |
| Interquartile Range (IQR) | 4.9% | 4.9% |
| Standard Deviation (Sample) | 4.7% | 6.3% |
| Standard Deviation (Population) | 4.7% | 6.2% |
Similar Demographics by Unemployment Among Youth under 25 years
Demographics Similar to Immigrants from Armenia by Unemployment Among Youth under 25 years
In terms of unemployment among youth under 25 years, the demographic groups most similar to Immigrants from Armenia are Jamaican (14.4%, a difference of 0.090%), Sioux (14.4%, a difference of 0.20%), Native/Alaskan (14.5%, a difference of 0.63%), Black/African American (14.5%, a difference of 0.71%), and Vietnamese (14.3%, a difference of 0.83%).
| Demographics | Rating | Rank | Unemployment Among Youth under 25 years |
| Pueblo | 0.0 /100 | #306 | Tragic 13.9% |
| Immigrants | Haiti | 0.0 /100 | #307 | Tragic 14.0% |
| Immigrants | Belize | 0.0 /100 | #308 | Tragic 14.0% |
| Aleuts | 0.0 /100 | #309 | Tragic 14.1% |
| Immigrants | West Indies | 0.0 /100 | #310 | Tragic 14.2% |
| Immigrants | Bangladesh | 0.0 /100 | #311 | Tragic 14.2% |
| Vietnamese | 0.0 /100 | #312 | Tragic 14.3% |
| Immigrants | Armenia | 0.0 /100 | #313 | Tragic 14.4% |
| Jamaicans | 0.0 /100 | #314 | Tragic 14.4% |
| Sioux | 0.0 /100 | #315 | Tragic 14.4% |
| Natives/Alaskans | 0.0 /100 | #316 | Tragic 14.5% |
| Blacks/African Americans | 0.0 /100 | #317 | Tragic 14.5% |
| Immigrants | Dominica | 0.0 /100 | #318 | Tragic 14.6% |
| West Indians | 0.0 /100 | #319 | Tragic 14.6% |
| Barbadians | 0.0 /100 | #320 | Tragic 14.6% |
Demographics Similar to Osage by Unemployment Among Youth under 25 years
In terms of unemployment among youth under 25 years, the demographic groups most similar to Osage are Chinese (10.7%, a difference of 0.060%), Slovene (10.7%, a difference of 0.11%), Taiwanese (10.8%, a difference of 0.37%), Somali (10.7%, a difference of 0.41%), and Yugoslavian (10.7%, a difference of 0.45%).
| Demographics | Rating | Rank | Unemployment Among Youth under 25 years |
| Immigrants | Bosnia and Herzegovina | 100.0 /100 | #23 | Exceptional 10.6% |
| Finns | 100.0 /100 | #24 | Exceptional 10.7% |
| Immigrants | North Macedonia | 100.0 /100 | #25 | Exceptional 10.7% |
| Immigrants | India | 100.0 /100 | #26 | Exceptional 10.7% |
| Yugoslavians | 100.0 /100 | #27 | Exceptional 10.7% |
| Somalis | 100.0 /100 | #28 | Exceptional 10.7% |
| Chinese | 99.9 /100 | #29 | Exceptional 10.7% |
| Osage | 99.9 /100 | #30 | Exceptional 10.7% |
| Slovenes | 99.9 /100 | #31 | Exceptional 10.7% |
| Taiwanese | 99.9 /100 | #32 | Exceptional 10.8% |
| Europeans | 99.9 /100 | #33 | Exceptional 10.8% |
| English | 99.9 /100 | #34 | Exceptional 10.8% |
| Immigrants | Nepal | 99.9 /100 | #35 | Exceptional 10.8% |
| Hmong | 99.8 /100 | #36 | Exceptional 10.8% |
| Immigrants | Zimbabwe | 99.8 /100 | #37 | Exceptional 10.8% |