Assyrian/Chaldean/Syriac vs Osage Unemployment Among Youth under 25 years
COMPARE
Assyrian/Chaldean/Syriac
Osage
Unemployment Among Youth under 25 years
Unemployment Among Youth under 25 years Comparison
Assyrians/Chaldeans/Syriacs
Osage
11.9%
UNEMPLOYMENT AMONG YOUTH UNDER 25 YEARS
9.8/ 100
METRIC RATING
210th/ 347
METRIC RANK
10.7%
UNEMPLOYMENT AMONG YOUTH UNDER 25 YEARS
99.9/ 100
METRIC RATING
30th/ 347
METRIC RANK
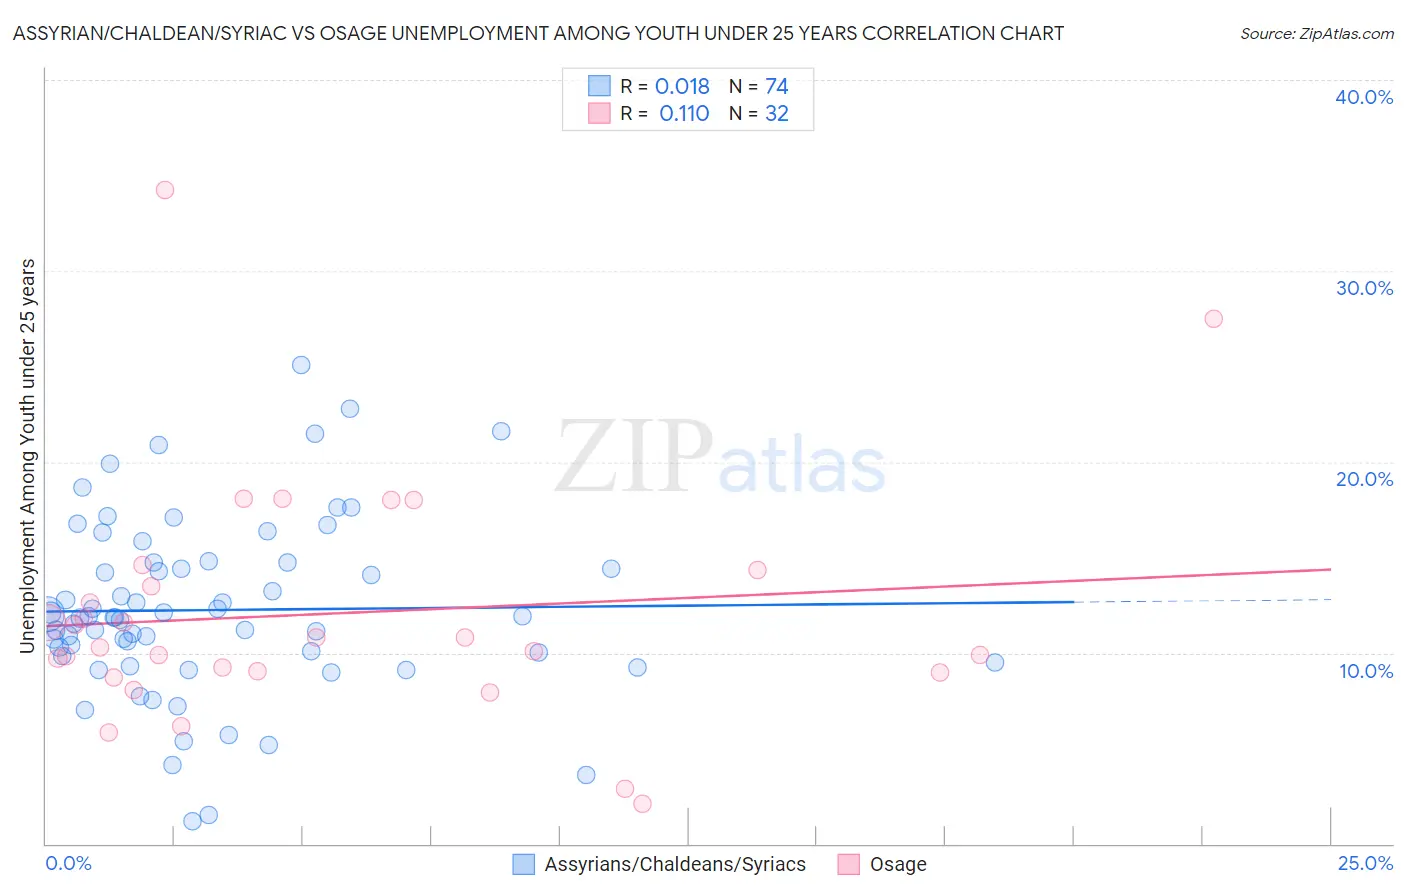
Assyrian/Chaldean/Syriac vs Osage Unemployment Among Youth under 25 years Correlation Chart
The statistical analysis conducted on geographies consisting of 109,923,358 people shows no correlation between the proportion of Assyrians/Chaldeans/Syriacs and unemployment rate among youth under the age of 25 in the United States with a correlation coefficient (R) of 0.018 and weighted average of 11.9%. Similarly, the statistical analysis conducted on geographies consisting of 91,372,569 people shows a poor positive correlation between the proportion of Osage and unemployment rate among youth under the age of 25 in the United States with a correlation coefficient (R) of 0.110 and weighted average of 10.7%, a difference of 10.7%.
Unemployment Among Youth under 25 years Correlation Summary
| Measurement | Assyrian/Chaldean/Syriac | Osage |
| Minimum | 1.2% | 2.1% |
| Maximum | 25.1% | 34.2% |
| Range | 23.9% | 32.1% |
| Mean | 12.2% | 12.1% |
| Median | 11.9% | 10.5% |
| Interquartile 25% (IQ1) | 9.8% | 9.0% |
| Interquartile 75% (IQ3) | 14.7% | 13.9% |
| Interquartile Range (IQR) | 4.9% | 4.9% |
| Standard Deviation (Sample) | 4.6% | 6.3% |
| Standard Deviation (Population) | 4.6% | 6.2% |
Similar Demographics by Unemployment Among Youth under 25 years
Demographics Similar to Assyrians/Chaldeans/Syriacs by Unemployment Among Youth under 25 years
In terms of unemployment among youth under 25 years, the demographic groups most similar to Assyrians/Chaldeans/Syriacs are Immigrants from Philippines (11.9%, a difference of 0.070%), Colombian (11.9%, a difference of 0.090%), Immigrants from Lebanon (11.8%, a difference of 0.15%), South American (11.9%, a difference of 0.16%), and Costa Rican (11.9%, a difference of 0.21%).
| Demographics | Rating | Rank | Unemployment Among Youth under 25 years |
| Immigrants | Peru | 15.3 /100 | #203 | Poor 11.8% |
| Immigrants | Costa Rica | 15.2 /100 | #204 | Poor 11.8% |
| Peruvians | 14.0 /100 | #205 | Poor 11.8% |
| Immigrants | Pakistan | 12.6 /100 | #206 | Poor 11.8% |
| Immigrants | Southern Europe | 12.3 /100 | #207 | Poor 11.8% |
| Comanche | 12.1 /100 | #208 | Poor 11.8% |
| Immigrants | Lebanon | 11.3 /100 | #209 | Poor 11.8% |
| Assyrians/Chaldeans/Syriacs | 9.8 /100 | #210 | Tragic 11.9% |
| Immigrants | Philippines | 9.2 /100 | #211 | Tragic 11.9% |
| Colombians | 9.1 /100 | #212 | Tragic 11.9% |
| South Americans | 8.5 /100 | #213 | Tragic 11.9% |
| Costa Ricans | 8.2 /100 | #214 | Tragic 11.9% |
| Samoans | 7.4 /100 | #215 | Tragic 11.9% |
| Guamanians/Chamorros | 7.0 /100 | #216 | Tragic 11.9% |
| Yaqui | 6.9 /100 | #217 | Tragic 11.9% |
Demographics Similar to Osage by Unemployment Among Youth under 25 years
In terms of unemployment among youth under 25 years, the demographic groups most similar to Osage are Chinese (10.7%, a difference of 0.060%), Slovene (10.7%, a difference of 0.11%), Taiwanese (10.8%, a difference of 0.37%), Somali (10.7%, a difference of 0.41%), and Yugoslavian (10.7%, a difference of 0.45%).
| Demographics | Rating | Rank | Unemployment Among Youth under 25 years |
| Immigrants | Bosnia and Herzegovina | 100.0 /100 | #23 | Exceptional 10.6% |
| Finns | 100.0 /100 | #24 | Exceptional 10.7% |
| Immigrants | North Macedonia | 100.0 /100 | #25 | Exceptional 10.7% |
| Immigrants | India | 100.0 /100 | #26 | Exceptional 10.7% |
| Yugoslavians | 100.0 /100 | #27 | Exceptional 10.7% |
| Somalis | 100.0 /100 | #28 | Exceptional 10.7% |
| Chinese | 99.9 /100 | #29 | Exceptional 10.7% |
| Osage | 99.9 /100 | #30 | Exceptional 10.7% |
| Slovenes | 99.9 /100 | #31 | Exceptional 10.7% |
| Taiwanese | 99.9 /100 | #32 | Exceptional 10.8% |
| Europeans | 99.9 /100 | #33 | Exceptional 10.8% |
| English | 99.9 /100 | #34 | Exceptional 10.8% |
| Immigrants | Nepal | 99.9 /100 | #35 | Exceptional 10.8% |
| Hmong | 99.8 /100 | #36 | Exceptional 10.8% |
| Immigrants | Zimbabwe | 99.8 /100 | #37 | Exceptional 10.8% |