Immigrants from Africa vs Immigrants from Netherlands Unemployment

COMPARE

Immigrants from Africa
Race
Ancestry
AfghanAfricanAlaska NativeAlaskan AthabascanAlbanianAleutAlsatianAmericanApacheArabArapahoArgentineanArmenianAssyrian/Chaldean/SyriacAustralianAustrianBahamianBangladeshiBarbadianBasqueBelgianBelizeanBermudanBhutaneseBlackfeetBolivianBrazilianBritishBritish West IndianBulgarianBurmeseCajunCambodianCanadianCape VerdeanCarpatho RusynCelticCentral AmericanCentral American IndianCherokeeCheyenneChickasawChileanChineseChippewaChoctawColombianColvilleComancheCosta RicanCreeCreekCroatianCrowCubanCypriotCzechCzechoslovakianDanishDelawareDominicanDutchDutch West IndianEastern EuropeanEcuadorianEgyptianEnglishEstonianEthiopianEuropeanFijianFilipinoFinnishFrenchFrench American IndianFrench CanadianGermanGerman RussianGhanaianGreekGuamanian/ChamorroGuatemalanGuyaneseHaitianHmongHonduranHopiHoumaHungarianIcelanderIndian (Asian)IndonesianInupiatIranianIraqiIrishIroquoisIsraeliItalianJamaicanJapaneseJordanianKenyanKiowaKoreanLaotianLatvianLebaneseLiberianLithuanianLumbeeLuxembourgerMacedonianMalaysianMalteseMarshalleseMenomineeMexicanMexican American IndianMongolianMoroccanNative HawaiianNavajoNepaleseNew ZealanderNicaraguanNigerianNorthern EuropeanNorwegianOkinawanOsageOttawaPaiutePakistaniPalestinianPanamanianParaguayanPennsylvania GermanPeruvianPimaPolishPortuguesePotawatomiPuebloPuerto RicanPuget Sound SalishRomanianRussianSalvadoranSamoanScandinavianScotch-IrishScottishSeminoleSenegaleseSerbianShoshoneSierra LeoneanSiouxSlavicSlovakSloveneSomaliSouth AfricanSouth AmericanSouth American IndianSoviet UnionSpaniardSpanishSpanish AmericanSpanish American IndianSri LankanSubsaharan AfricanSudaneseSwedishSwissSyrianTaiwaneseThaiTlingit-HaidaTohono O'OdhamTonganTrinidadian and TobagonianTsimshianTurkishU.S. Virgin IslanderUgandanUkrainianUruguayanUteVenezuelanVietnameseWelshWest IndianYakamaYaquiYugoslavianYumanYup'ikZimbabwean
Immigration
NonimmigrantsImmigrantsAfghanistanAfricaAlbaniaArgentinaArmeniaAsiaAustraliaAustriaBahamasBangladeshBarbadosBelarusBelgiumBelizeBoliviaBosnia and HerzegovinaBrazilBulgariaBurma/MyanmarCabo VerdeCambodiaCameroonCanadaCaribbeanCentral AmericaChileChinaColombiaCongoCosta RicaCroatiaCubaCzechoslovakiaDenmarkDominicaDominican RepublicEastern AfricaEastern AsiaEastern EuropeEcuadorEgyptEl SalvadorEnglandEritreaEthiopiaEuropeFijiFranceGermanyGhanaGreeceGrenadaGuatemalaGuyanaHaitiHondurasHong KongHungaryIndiaIndonesiaIranIraqIrelandIsraelItalyJamaicaJapanJordanKazakhstanKenyaKoreaKuwaitLaosLatin AmericaLatviaLebanonLiberiaLithuaniaMalaysiaMexicoMicronesiaMiddle AfricaMoldovaMoroccoNepalNicaraguaNigeriaNorth AmericaNorth MacedoniaNorthern AfricaNorthern EuropeNorwayOceaniaPakistanPanamaPeruPhilippinesPolandPortugalRomaniaRussiaSaudi ArabiaScotlandSenegalSerbiaSierra LeoneSingaporeSomaliaSouth AfricaSouth AmericaSouth Central AsiaSouth Eastern AsiaSouthern EuropeSpainSri LankaSt. Vincent and the GrenadinesSudanSwedenSwitzerlandSyriaTaiwanThailandTrinidad and TobagoTurkeyUgandaUkraineUruguayUzbekistanVenezuelaVietnamWest IndiesWestern AfricaWestern AsiaWestern EuropeYemenZaireZimbabweAzores
Immigrants from Netherlands
Race
Ancestry
AfghanAfricanAlaska NativeAlaskan AthabascanAlbanianAleutAlsatianAmericanApacheArabArapahoArgentineanArmenianAssyrian/Chaldean/SyriacAustralianAustrianBahamianBangladeshiBarbadianBasqueBelgianBelizeanBermudanBhutaneseBlackfeetBolivianBrazilianBritishBritish West IndianBulgarianBurmeseCajunCambodianCanadianCape VerdeanCarpatho RusynCelticCentral AmericanCentral American IndianCherokeeCheyenneChickasawChileanChineseChippewaChoctawColombianColvilleComancheCosta RicanCreeCreekCroatianCrowCubanCypriotCzechCzechoslovakianDanishDelawareDominicanDutchDutch West IndianEastern EuropeanEcuadorianEgyptianEnglishEstonianEthiopianEuropeanFijianFilipinoFinnishFrenchFrench American IndianFrench CanadianGermanGerman RussianGhanaianGreekGuamanian/ChamorroGuatemalanGuyaneseHaitianHmongHonduranHopiHoumaHungarianIcelanderIndian (Asian)IndonesianInupiatIranianIraqiIrishIroquoisIsraeliItalianJamaicanJapaneseJordanianKenyanKiowaKoreanLaotianLatvianLebaneseLiberianLithuanianLumbeeLuxembourgerMacedonianMalaysianMalteseMarshalleseMenomineeMexicanMexican American IndianMongolianMoroccanNative HawaiianNavajoNepaleseNew ZealanderNicaraguanNigerianNorthern EuropeanNorwegianOkinawanOsageOttawaPaiutePakistaniPalestinianPanamanianParaguayanPennsylvania GermanPeruvianPimaPolishPortuguesePotawatomiPuebloPuerto RicanPuget Sound SalishRomanianRussianSalvadoranSamoanScandinavianScotch-IrishScottishSeminoleSenegaleseSerbianShoshoneSierra LeoneanSiouxSlavicSlovakSloveneSomaliSouth AfricanSouth AmericanSouth American IndianSoviet UnionSpaniardSpanishSpanish AmericanSpanish American IndianSri LankanSubsaharan AfricanSudaneseSwedishSwissSyrianTaiwaneseThaiTlingit-HaidaTohono O'OdhamTonganTrinidadian and TobagonianTsimshianTurkishU.S. Virgin IslanderUgandanUkrainianUruguayanUteVenezuelanVietnameseWelshWest IndianYakamaYaquiYugoslavianYumanYup'ikZimbabwean
Immigration
NonimmigrantsImmigrantsAfghanistanAlbaniaArgentinaArmeniaAsiaAustraliaAustriaBahamasBangladeshBarbadosBelarusBelgiumBelizeBoliviaBosnia and HerzegovinaBrazilBulgariaBurma/MyanmarCabo VerdeCambodiaCameroonCanadaCaribbeanCentral AmericaChileChinaColombiaCongoCosta RicaCroatiaCubaCzechoslovakiaDenmarkDominicaDominican RepublicEastern AfricaEastern AsiaEastern EuropeEcuadorEgyptEl SalvadorEnglandEritreaEthiopiaEuropeFijiFranceGermanyGhanaGreeceGrenadaGuatemalaGuyanaHaitiHondurasHong KongHungaryIndiaIndonesiaIranIraqIrelandIsraelItalyJamaicaJapanJordanKazakhstanKenyaKoreaKuwaitLaosLatin AmericaLatviaLebanonLiberiaLithuaniaMalaysiaMexicoMicronesiaMiddle AfricaMoldovaMoroccoNepalNetherlandsNicaraguaNigeriaNorth AmericaNorth MacedoniaNorthern AfricaNorthern EuropeNorwayOceaniaPakistanPanamaPeruPhilippinesPolandPortugalRomaniaRussiaSaudi ArabiaScotlandSenegalSerbiaSierra LeoneSingaporeSomaliaSouth AfricaSouth AmericaSouth Central AsiaSouth Eastern AsiaSouthern EuropeSpainSri LankaSt. Vincent and the GrenadinesSudanSwedenSwitzerlandSyriaTaiwanThailandTrinidad and TobagoTurkeyUgandaUkraineUruguayUzbekistanVenezuelaVietnamWest IndiesWestern AfricaWestern AsiaWestern EuropeYemenZaireZimbabweAzores
Unemployment
Income
Poverty
Unemployment
Labor Participation
Family Structure
Vehicle Availability
Education Level
Disability

Unemployment Comparison

Immigrants from Africa

Immigrants from Netherlands

Tragic
Exceptional
5.5%
UNEMPLOYMENT
4.9/ 100
METRIC RATING
231st/ 347
METRIC RANK
4.9%
UNEMPLOYMENT
99.0/ 100
METRIC RATING
60th/ 347
METRIC RANK

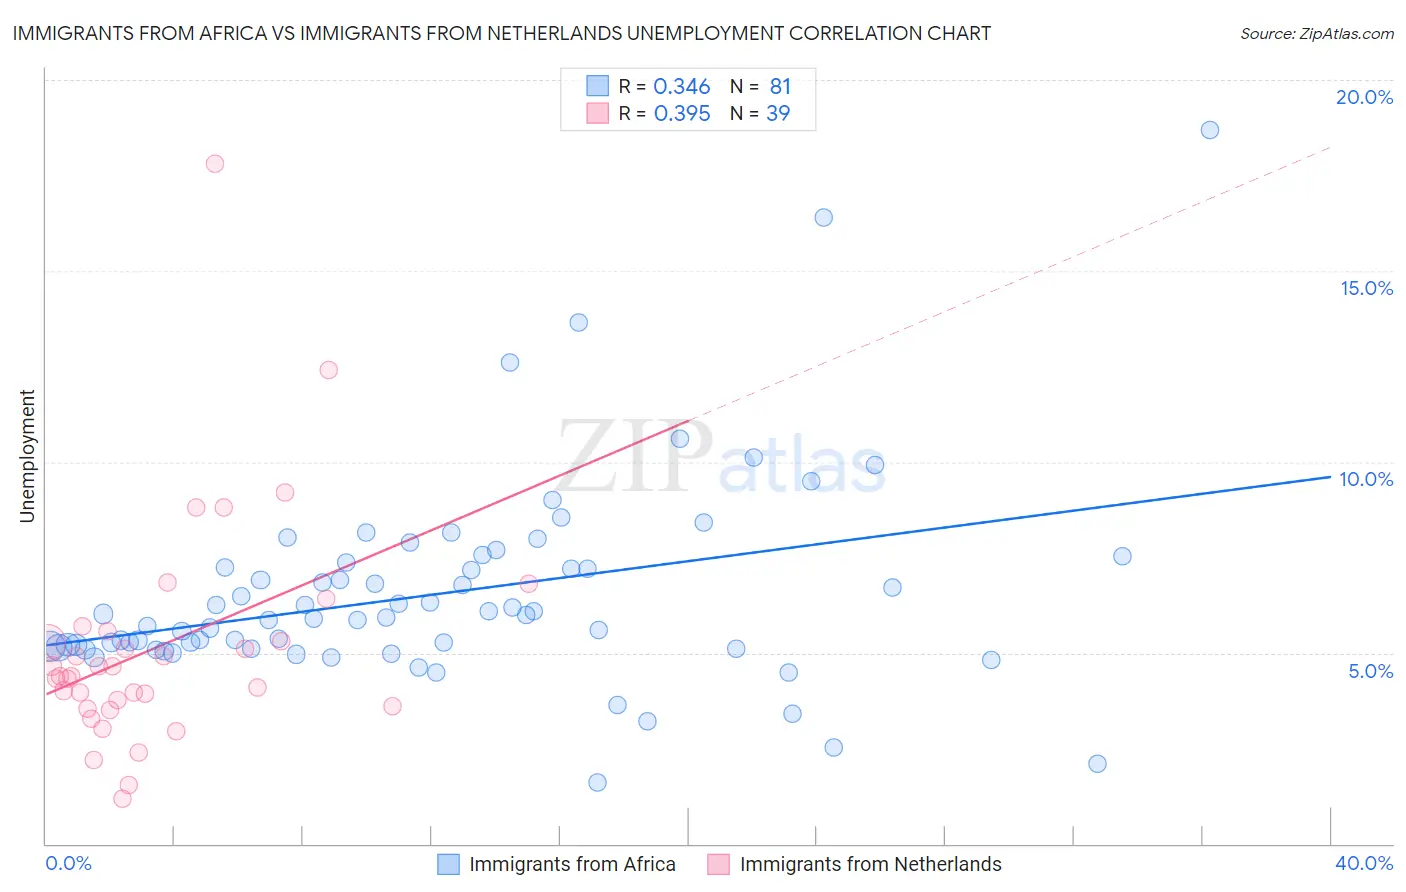
Immigrants from Africa vs Immigrants from Netherlands Unemployment Correlation Chart

The statistical analysis conducted on geographies consisting of 468,788,801 people shows a mild positive correlation between the proportion of Immigrants from Africa and unemployment in the United States with a correlation coefficient (R) of 0.346 and weighted average of 5.5%. Similarly, the statistical analysis conducted on geographies consisting of 237,753,486 people shows a mild positive correlation between the proportion of Immigrants from Netherlands and unemployment in the United States with a correlation coefficient (R) of 0.395 and weighted average of 4.9%, a difference of 12.4%.
Immigrants from Africa vs Immigrants from Netherlands Unemployment

Unemployment Correlation Summary

MeasurementImmigrants from AfricaImmigrants from Netherlands
Minimum1.6%1.2%
Maximum18.7%17.8%
Range17.1%16.6%
Mean6.5%5.2%
Median5.9%4.4%
Interquartile 25% (IQ1)5.1%3.6%
Interquartile 75% (IQ3)7.3%5.6%
Interquartile Range (IQR)2.2%2.0%
Standard Deviation (Sample)2.7%3.0%
Standard Deviation (Population)2.6%3.0%

Similar Demographics by Unemployment

Demographics Similar to Immigrants from Africa by Unemployment

In terms of unemployment, the demographic groups most similar to Immigrants from Africa are Comanche (5.5%, a difference of 0.0%), Immigrants from Syria (5.5%, a difference of 0.050%), Panamanian (5.5%, a difference of 0.080%), Hawaiian (5.5%, a difference of 0.13%), and Ottawa (5.5%, a difference of 0.13%).
DemographicsRating | RankUnemployment
Israelis
8.8
/100
|
#224
Tragic
5.4%
South American Indians
7.8
/100
|
#225
Tragic
5.5%
Samoans
7.1
/100
|
#226
Tragic
5.5%
Immigrants | Lebanon
7.0
/100
|
#227
Tragic
5.5%
Guamanians/Chamorros
6.3
/100
|
#228
Tragic
5.5%
Hawaiians
5.4
/100
|
#229
Tragic
5.5%
Ottawa
5.4
/100
|
#230
Tragic
5.5%
Immigrants | Africa
4.9
/100
|
#231
Tragic
5.5%
Comanche
4.9
/100
|
#232
Tragic
5.5%
Immigrants | Syria
4.8
/100
|
#233
Tragic
5.5%
Panamanians
4.7
/100
|
#234
Tragic
5.5%
Immigrants | Panama
3.4
/100
|
#235
Tragic
5.5%
Immigrants | Cambodia
3.3
/100
|
#236
Tragic
5.5%
Moroccans
3.2
/100
|
#237
Tragic
5.5%
Immigrants | Western Asia
2.8
/100
|
#238
Tragic
5.5%

Demographics Similar to Immigrants from Netherlands by Unemployment

In terms of unemployment, the demographic groups most similar to Immigrants from Netherlands are Cambodian (4.9%, a difference of 0.0%), Icelander (4.9%, a difference of 0.010%), Immigrants from Bulgaria (4.9%, a difference of 0.030%), Bhutanese (4.9%, a difference of 0.050%), and Greek (4.9%, a difference of 0.070%).
DemographicsRating | RankUnemployment
Immigrants | Zimbabwe
99.2
/100
|
#53
Exceptional
4.9%
Eastern Europeans
99.2
/100
|
#54
Exceptional
4.9%
Australians
99.2
/100
|
#55
Exceptional
4.9%
Celtics
99.1
/100
|
#56
Exceptional
4.9%
Immigrants | Singapore
99.1
/100
|
#57
Exceptional
4.9%
Greeks
99.0
/100
|
#58
Exceptional
4.9%
Bhutanese
99.0
/100
|
#59
Exceptional
4.9%
Immigrants | Netherlands
99.0
/100
|
#60
Exceptional
4.9%
Cambodians
99.0
/100
|
#61
Exceptional
4.9%
Icelanders
98.9
/100
|
#62
Exceptional
4.9%
Immigrants | Bulgaria
98.9
/100
|
#63
Exceptional
4.9%
Italians
98.9
/100
|
#64
Exceptional
4.9%
Immigrants | Canada
98.8
/100
|
#65
Exceptional
4.9%
Slovaks
98.7
/100
|
#66
Exceptional
4.9%
New Zealanders
98.6
/100
|
#67
Exceptional
4.9%