Houma vs Immigrants from Asia Female Unemployment
COMPARE
Houma
Immigrants from Asia
Female Unemployment
Female Unemployment Comparison
Houma
Immigrants from Asia
6.4%
FEMALE UNEMPLOYMENT
0.0/ 100
METRIC RATING
316th/ 347
METRIC RANK
5.2%
FEMALE UNEMPLOYMENT
64.3/ 100
METRIC RATING
163rd/ 347
METRIC RANK
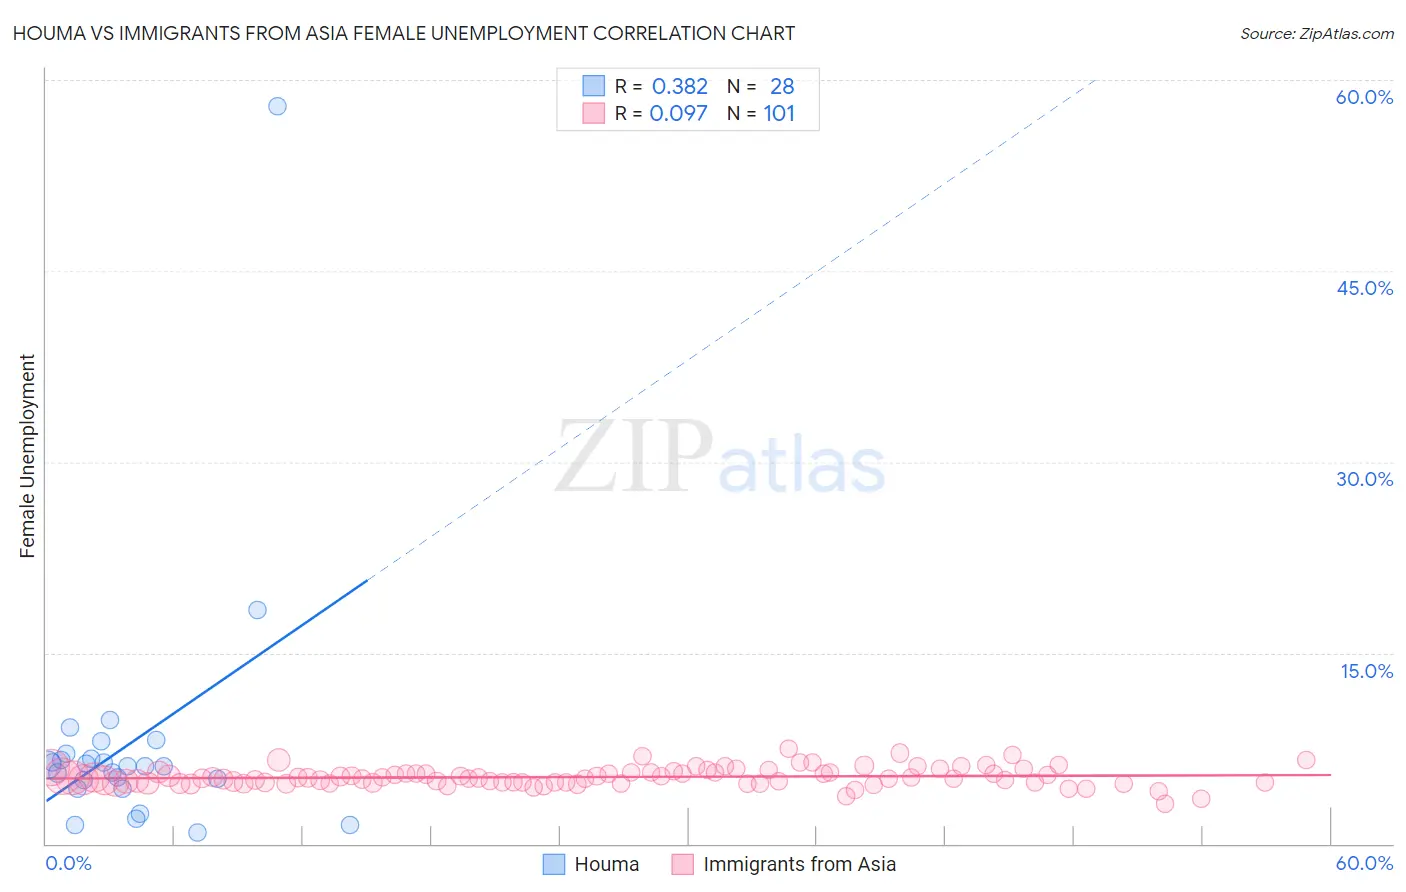
Houma vs Immigrants from Asia Female Unemployment Correlation Chart
The statistical analysis conducted on geographies consisting of 36,709,264 people shows a mild positive correlation between the proportion of Houma and unemploymnet rate among females in the United States with a correlation coefficient (R) of 0.382 and weighted average of 6.4%. Similarly, the statistical analysis conducted on geographies consisting of 540,737,875 people shows a slight positive correlation between the proportion of Immigrants from Asia and unemploymnet rate among females in the United States with a correlation coefficient (R) of 0.097 and weighted average of 5.2%, a difference of 22.8%.
Female Unemployment Correlation Summary
| Measurement | Houma | Immigrants from Asia |
| Minimum | 0.90% | 3.1% |
| Maximum | 57.9% | 7.5% |
| Range | 57.0% | 4.4% |
| Mean | 7.8% | 5.2% |
| Median | 6.1% | 5.2% |
| Interquartile 25% (IQ1) | 4.7% | 4.8% |
| Interquartile 75% (IQ3) | 6.9% | 5.6% |
| Interquartile Range (IQR) | 2.2% | 0.82% |
| Standard Deviation (Sample) | 10.4% | 0.72% |
| Standard Deviation (Population) | 10.2% | 0.72% |
Similar Demographics by Female Unemployment
Demographics Similar to Houma by Female Unemployment
In terms of female unemployment, the demographic groups most similar to Houma are Pueblo (6.4%, a difference of 0.29%), Immigrants from St. Vincent and the Grenadines (6.4%, a difference of 0.45%), Immigrants from Ecuador (6.4%, a difference of 0.60%), British West Indian (6.4%, a difference of 0.73%), and Belizean (6.3%, a difference of 0.83%).
| Demographics | Rating | Rank | Female Unemployment |
| Ecuadorians | 0.0 /100 | #309 | Tragic 6.3% |
| Central American Indians | 0.0 /100 | #310 | Tragic 6.3% |
| Immigrants | Mexico | 0.0 /100 | #311 | Tragic 6.3% |
| Immigrants | Grenada | 0.0 /100 | #312 | Tragic 6.3% |
| Belizeans | 0.0 /100 | #313 | Tragic 6.3% |
| Immigrants | Ecuador | 0.0 /100 | #314 | Tragic 6.4% |
| Pueblo | 0.0 /100 | #315 | Tragic 6.4% |
| Houma | 0.0 /100 | #316 | Tragic 6.4% |
| Immigrants | St. Vincent and the Grenadines | 0.0 /100 | #317 | Tragic 6.4% |
| British West Indians | 0.0 /100 | #318 | Tragic 6.4% |
| Immigrants | Bangladesh | 0.0 /100 | #319 | Tragic 6.5% |
| Immigrants | Dominica | 0.0 /100 | #320 | Tragic 6.5% |
| Blacks/African Americans | 0.0 /100 | #321 | Tragic 6.5% |
| Vietnamese | 0.0 /100 | #322 | Tragic 6.5% |
| Immigrants | Belize | 0.0 /100 | #323 | Tragic 6.5% |
Demographics Similar to Immigrants from Asia by Female Unemployment
In terms of female unemployment, the demographic groups most similar to Immigrants from Asia are Bangladeshi (5.2%, a difference of 0.0%), Syrian (5.2%, a difference of 0.10%), Native Hawaiian (5.2%, a difference of 0.10%), Potawatomi (5.2%, a difference of 0.11%), and Immigrants from Thailand (5.2%, a difference of 0.14%).
| Demographics | Rating | Rank | Female Unemployment |
| Immigrants | Northern Africa | 69.6 /100 | #156 | Good 5.2% |
| Immigrants | Russia | 69.3 /100 | #157 | Good 5.2% |
| Albanians | 68.3 /100 | #158 | Good 5.2% |
| Immigrants | Micronesia | 66.9 /100 | #159 | Good 5.2% |
| Immigrants | Spain | 66.8 /100 | #160 | Good 5.2% |
| Immigrants | Pakistan | 66.7 /100 | #161 | Good 5.2% |
| Potawatomi | 65.9 /100 | #162 | Good 5.2% |
| Immigrants | Asia | 64.3 /100 | #163 | Good 5.2% |
| Bangladeshis | 64.3 /100 | #164 | Good 5.2% |
| Syrians | 62.8 /100 | #165 | Good 5.2% |
| Native Hawaiians | 62.7 /100 | #166 | Good 5.2% |
| Immigrants | Thailand | 62.1 /100 | #167 | Good 5.2% |
| Sri Lankans | 59.4 /100 | #168 | Average 5.2% |
| Immigrants | Chile | 59.0 /100 | #169 | Average 5.2% |
| Spanish | 55.9 /100 | #170 | Average 5.2% |