Honduran vs Nigerian Unemployment Among Ages 30 to 34 years
COMPARE
Honduran
Nigerian
Unemployment Among Ages 30 to 34 years
Unemployment Among Ages 30 to 34 years Comparison
Hondurans
Nigerians
6.0%
UNEMPLOYMENT AMONG AGES 30 TO 34 YEARS
0.3/ 100
METRIC RATING
249th/ 347
METRIC RANK
6.0%
UNEMPLOYMENT AMONG AGES 30 TO 34 YEARS
0.3/ 100
METRIC RATING
247th/ 347
METRIC RANK
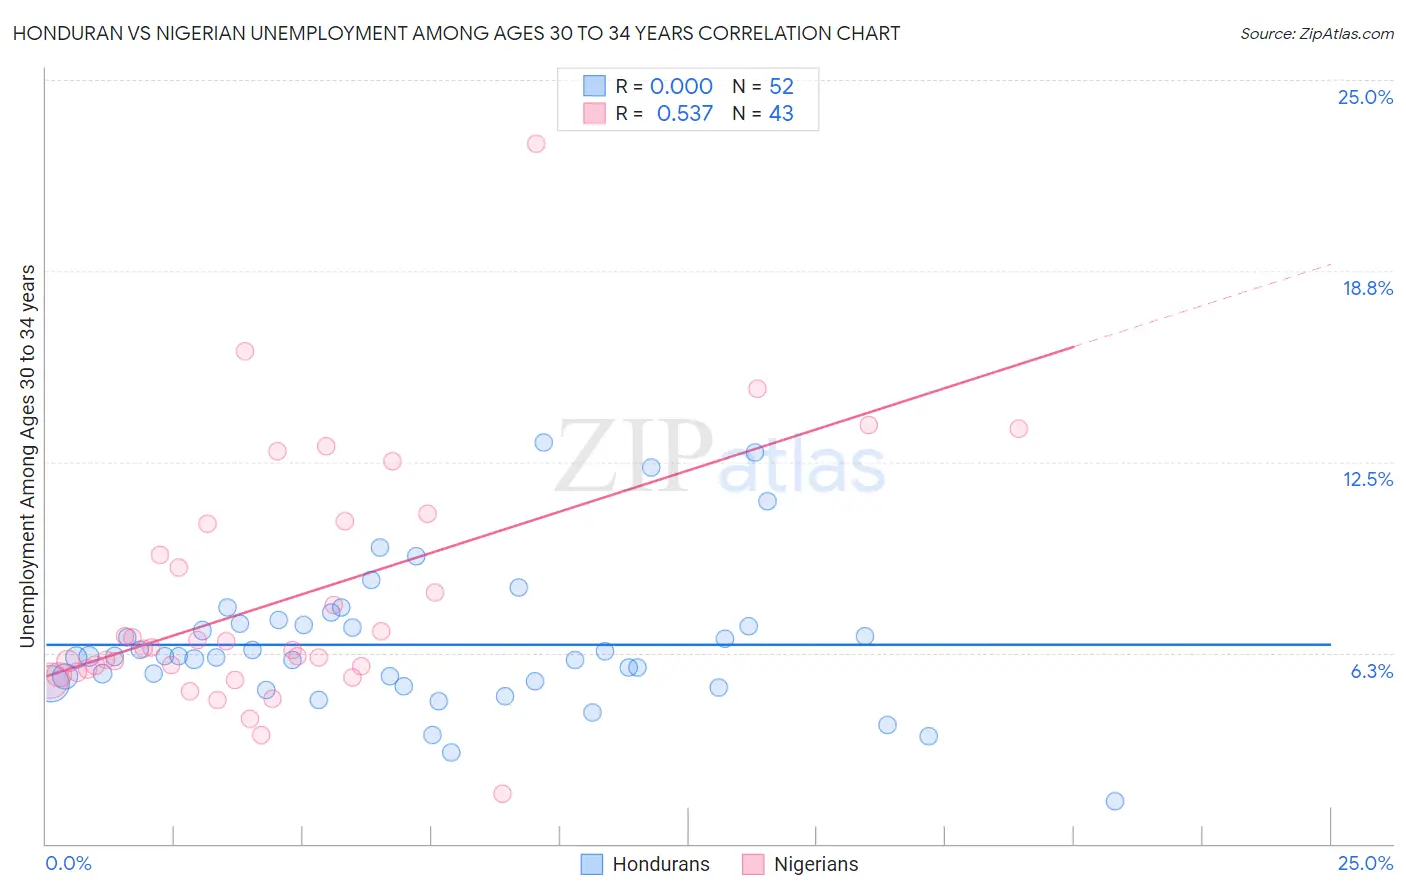
Honduran vs Nigerian Unemployment Among Ages 30 to 34 years Correlation Chart
The statistical analysis conducted on geographies consisting of 342,831,015 people shows no correlation between the proportion of Hondurans and unemployment rate among population between the ages 30 and 34 in the United States with a correlation coefficient (R) of 0.000 and weighted average of 6.0%. Similarly, the statistical analysis conducted on geographies consisting of 321,115,891 people shows a substantial positive correlation between the proportion of Nigerians and unemployment rate among population between the ages 30 and 34 in the United States with a correlation coefficient (R) of 0.537 and weighted average of 6.0%, a difference of 0.010%.
Unemployment Among Ages 30 to 34 years Correlation Summary
| Measurement | Honduran | Nigerian |
| Minimum | 1.4% | 1.6% |
| Maximum | 13.1% | 22.9% |
| Range | 11.7% | 21.3% |
| Mean | 6.5% | 8.0% |
| Median | 6.1% | 6.4% |
| Interquartile 25% (IQ1) | 5.3% | 5.6% |
| Interquartile 75% (IQ3) | 7.2% | 10.5% |
| Interquartile Range (IQR) | 1.9% | 4.9% |
| Standard Deviation (Sample) | 2.3% | 4.0% |
| Standard Deviation (Population) | 2.3% | 4.0% |
Demographics Similar to Hondurans and Nigerians by Unemployment Among Ages 30 to 34 years
In terms of unemployment among ages 30 to 34 years, the demographic groups most similar to Hondurans are Immigrants from Guatemala (6.0%, a difference of 0.0%), Ghanaian (6.0%, a difference of 0.070%), Immigrants from Honduras (6.0%, a difference of 0.090%), Subsaharan African (6.0%, a difference of 0.25%), and Immigrants from Micronesia (6.0%, a difference of 0.27%). Similarly, the demographic groups most similar to Nigerians are Immigrants from Guatemala (6.0%, a difference of 0.0%), Ghanaian (6.0%, a difference of 0.060%), Immigrants from Honduras (6.0%, a difference of 0.10%), Subsaharan African (6.0%, a difference of 0.25%), and Immigrants from Micronesia (6.0%, a difference of 0.27%).
| Demographics | Rating | Rank | Unemployment Among Ages 30 to 34 years |
| Mexican American Indians | 0.6 /100 | #238 | Tragic 5.9% |
| Immigrants | Nigeria | 0.6 /100 | #239 | Tragic 6.0% |
| Salvadorans | 0.5 /100 | #240 | Tragic 6.0% |
| Immigrants | El Salvador | 0.5 /100 | #241 | Tragic 6.0% |
| Guatemalans | 0.4 /100 | #242 | Tragic 6.0% |
| Immigrants | Liberia | 0.4 /100 | #243 | Tragic 6.0% |
| Immigrants | Micronesia | 0.3 /100 | #244 | Tragic 6.0% |
| Sub-Saharan Africans | 0.3 /100 | #245 | Tragic 6.0% |
| Ghanaians | 0.3 /100 | #246 | Tragic 6.0% |
| Nigerians | 0.3 /100 | #247 | Tragic 6.0% |
| Immigrants | Guatemala | 0.3 /100 | #248 | Tragic 6.0% |
| Hondurans | 0.3 /100 | #249 | Tragic 6.0% |
| Immigrants | Honduras | 0.3 /100 | #250 | Tragic 6.0% |
| Tlingit-Haida | 0.2 /100 | #251 | Tragic 6.0% |
| Potawatomi | 0.2 /100 | #252 | Tragic 6.0% |
| Immigrants | Nonimmigrants | 0.2 /100 | #253 | Tragic 6.1% |
| Armenians | 0.1 /100 | #254 | Tragic 6.1% |
| Immigrants | Portugal | 0.1 /100 | #255 | Tragic 6.1% |
| Immigrants | Ghana | 0.1 /100 | #256 | Tragic 6.1% |
| Immigrants | Sierra Leone | 0.1 /100 | #257 | Tragic 6.1% |
| Mexicans | 0.1 /100 | #258 | Tragic 6.1% |