Delaware vs Nigerian Unemployment Among Ages 30 to 34 years
COMPARE
Delaware
Nigerian
Unemployment Among Ages 30 to 34 years
Unemployment Among Ages 30 to 34 years Comparison
Delaware
Nigerians
6.7%
UNEMPLOYMENT AMONG AGES 30 TO 34 YEARS
0.0/ 100
METRIC RATING
302nd/ 347
METRIC RANK
6.0%
UNEMPLOYMENT AMONG AGES 30 TO 34 YEARS
0.3/ 100
METRIC RATING
247th/ 347
METRIC RANK
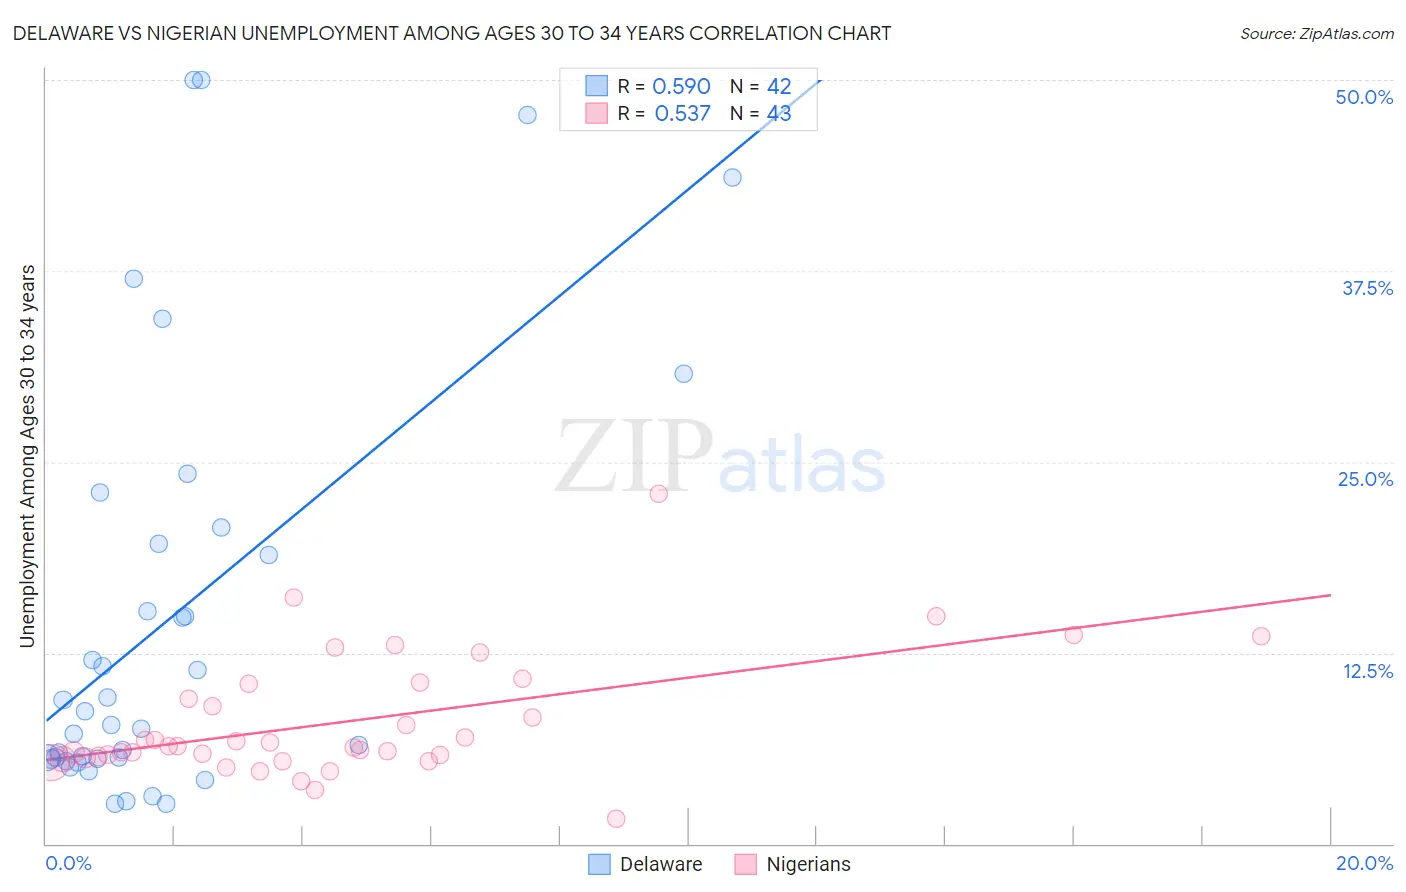
Delaware vs Nigerian Unemployment Among Ages 30 to 34 years Correlation Chart
The statistical analysis conducted on geographies consisting of 93,963,803 people shows a substantial positive correlation between the proportion of Delaware and unemployment rate among population between the ages 30 and 34 in the United States with a correlation coefficient (R) of 0.590 and weighted average of 6.7%. Similarly, the statistical analysis conducted on geographies consisting of 321,115,891 people shows a substantial positive correlation between the proportion of Nigerians and unemployment rate among population between the ages 30 and 34 in the United States with a correlation coefficient (R) of 0.537 and weighted average of 6.0%, a difference of 10.6%.
Unemployment Among Ages 30 to 34 years Correlation Summary
| Measurement | Delaware | Nigerian |
| Minimum | 2.6% | 1.6% |
| Maximum | 50.0% | 22.9% |
| Range | 47.4% | 21.3% |
| Mean | 14.7% | 8.0% |
| Median | 8.2% | 6.4% |
| Interquartile 25% (IQ1) | 5.6% | 5.6% |
| Interquartile 75% (IQ3) | 19.7% | 10.5% |
| Interquartile Range (IQR) | 14.1% | 4.9% |
| Standard Deviation (Sample) | 13.8% | 4.0% |
| Standard Deviation (Population) | 13.7% | 4.0% |
Similar Demographics by Unemployment Among Ages 30 to 34 years
Demographics Similar to Delaware by Unemployment Among Ages 30 to 34 years
In terms of unemployment among ages 30 to 34 years, the demographic groups most similar to Delaware are Cajun (6.7%, a difference of 0.19%), Kiowa (6.7%, a difference of 0.61%), Paiute (6.7%, a difference of 0.64%), Belizean (6.6%, a difference of 0.84%), and Bahamian (6.6%, a difference of 1.1%).
| Demographics | Rating | Rank | Unemployment Among Ages 30 to 34 years |
| Trinidadians and Tobagonians | 0.0 /100 | #295 | Tragic 6.5% |
| Immigrants | Jamaica | 0.0 /100 | #296 | Tragic 6.5% |
| Creek | 0.0 /100 | #297 | Tragic 6.6% |
| Immigrants | Barbados | 0.0 /100 | #298 | Tragic 6.6% |
| Dutch West Indians | 0.0 /100 | #299 | Tragic 6.6% |
| Bahamians | 0.0 /100 | #300 | Tragic 6.6% |
| Belizeans | 0.0 /100 | #301 | Tragic 6.6% |
| Delaware | 0.0 /100 | #302 | Tragic 6.7% |
| Cajuns | 0.0 /100 | #303 | Tragic 6.7% |
| Kiowa | 0.0 /100 | #304 | Tragic 6.7% |
| Paiute | 0.0 /100 | #305 | Tragic 6.7% |
| Immigrants | Armenia | 0.0 /100 | #306 | Tragic 6.8% |
| Immigrants | Belize | 0.0 /100 | #307 | Tragic 6.9% |
| Immigrants | Azores | 0.0 /100 | #308 | Tragic 6.9% |
| Immigrants | Grenada | 0.0 /100 | #309 | Tragic 6.9% |
Demographics Similar to Nigerians by Unemployment Among Ages 30 to 34 years
In terms of unemployment among ages 30 to 34 years, the demographic groups most similar to Nigerians are Immigrants from Guatemala (6.0%, a difference of 0.0%), Honduran (6.0%, a difference of 0.010%), Ghanaian (6.0%, a difference of 0.060%), Immigrants from Honduras (6.0%, a difference of 0.10%), and Subsaharan African (6.0%, a difference of 0.25%).
| Demographics | Rating | Rank | Unemployment Among Ages 30 to 34 years |
| Salvadorans | 0.5 /100 | #240 | Tragic 6.0% |
| Immigrants | El Salvador | 0.5 /100 | #241 | Tragic 6.0% |
| Guatemalans | 0.4 /100 | #242 | Tragic 6.0% |
| Immigrants | Liberia | 0.4 /100 | #243 | Tragic 6.0% |
| Immigrants | Micronesia | 0.3 /100 | #244 | Tragic 6.0% |
| Sub-Saharan Africans | 0.3 /100 | #245 | Tragic 6.0% |
| Ghanaians | 0.3 /100 | #246 | Tragic 6.0% |
| Nigerians | 0.3 /100 | #247 | Tragic 6.0% |
| Immigrants | Guatemala | 0.3 /100 | #248 | Tragic 6.0% |
| Hondurans | 0.3 /100 | #249 | Tragic 6.0% |
| Immigrants | Honduras | 0.3 /100 | #250 | Tragic 6.0% |
| Tlingit-Haida | 0.2 /100 | #251 | Tragic 6.0% |
| Potawatomi | 0.2 /100 | #252 | Tragic 6.0% |
| Immigrants | Nonimmigrants | 0.2 /100 | #253 | Tragic 6.1% |
| Armenians | 0.1 /100 | #254 | Tragic 6.1% |