Hmong vs Immigrants from Congo Female Unemployment
COMPARE
Hmong
Immigrants from Congo
Female Unemployment
Female Unemployment Comparison
Hmong
Immigrants from Congo
4.4%
FEMALE UNEMPLOYMENT
100.0/ 100
METRIC RATING
5th/ 347
METRIC RANK
5.3%
FEMALE UNEMPLOYMENT
43.1/ 100
METRIC RATING
180th/ 347
METRIC RANK
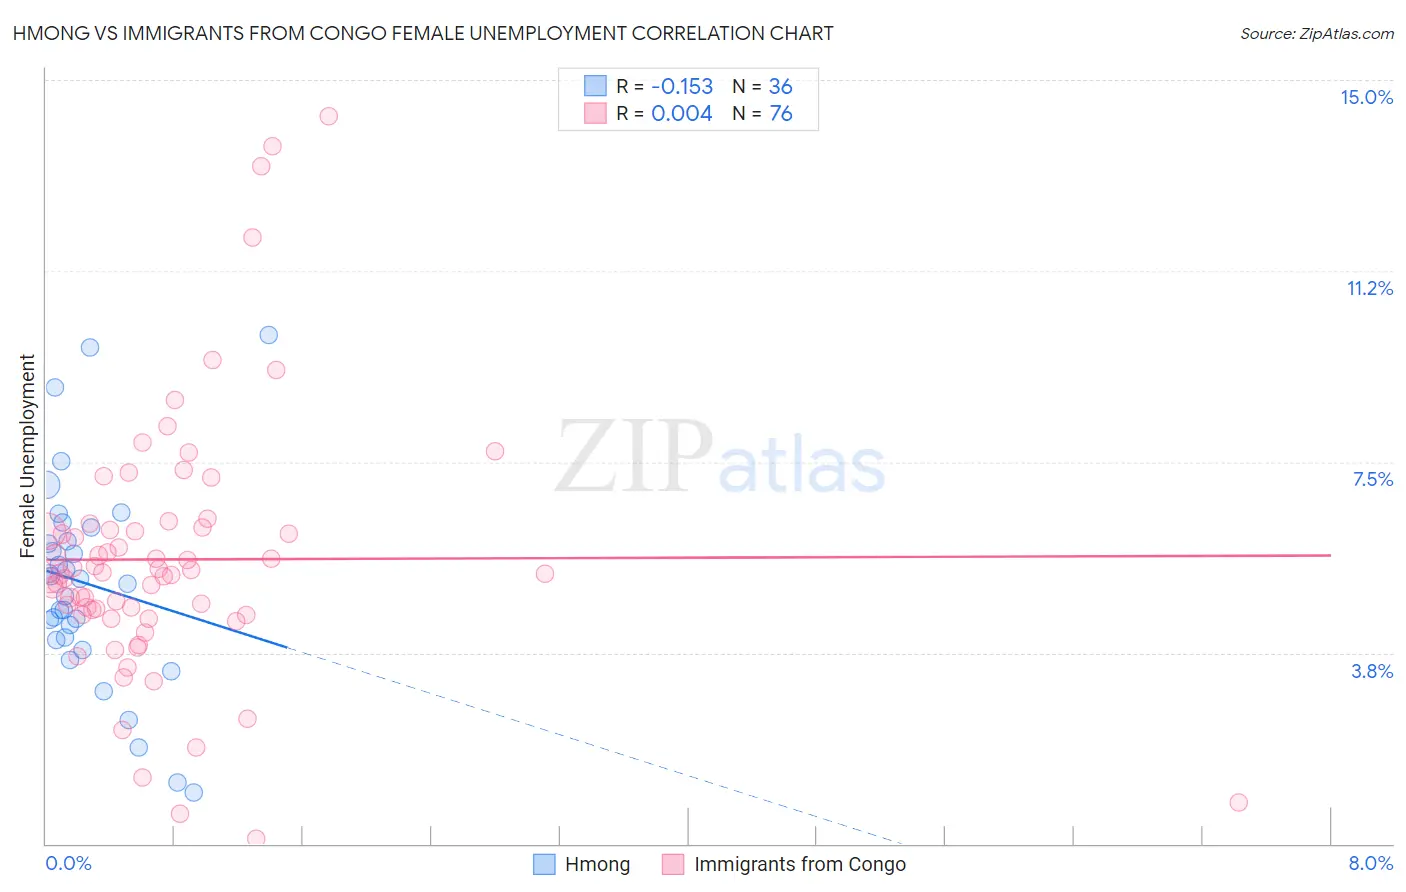
Hmong vs Immigrants from Congo Female Unemployment Correlation Chart
The statistical analysis conducted on geographies consisting of 24,652,438 people shows a poor negative correlation between the proportion of Hmong and unemploymnet rate among females in the United States with a correlation coefficient (R) of -0.153 and weighted average of 4.4%. Similarly, the statistical analysis conducted on geographies consisting of 92,074,429 people shows no correlation between the proportion of Immigrants from Congo and unemploymnet rate among females in the United States with a correlation coefficient (R) of 0.004 and weighted average of 5.3%, a difference of 20.1%.
Female Unemployment Correlation Summary
| Measurement | Hmong | Immigrants from Congo |
| Minimum | 1.0% | 0.10% |
| Maximum | 10.0% | 14.3% |
| Range | 9.0% | 14.2% |
| Mean | 5.1% | 5.6% |
| Median | 5.2% | 5.3% |
| Interquartile 25% (IQ1) | 4.0% | 4.5% |
| Interquartile 75% (IQ3) | 6.1% | 6.2% |
| Interquartile Range (IQR) | 2.0% | 1.7% |
| Standard Deviation (Sample) | 2.0% | 2.6% |
| Standard Deviation (Population) | 2.0% | 2.5% |
Similar Demographics by Female Unemployment
Demographics Similar to Hmong by Female Unemployment
In terms of female unemployment, the demographic groups most similar to Hmong are Danish (4.4%, a difference of 0.11%), Luxembourger (4.4%, a difference of 0.14%), Czech (4.4%, a difference of 0.15%), Swedish (4.4%, a difference of 1.2%), and Chinese (4.5%, a difference of 2.0%).
| Demographics | Rating | Rank | Female Unemployment |
| Norwegians | 100.0 /100 | #1 | Exceptional 4.2% |
| Czechs | 100.0 /100 | #2 | Exceptional 4.4% |
| Luxembourgers | 100.0 /100 | #3 | Exceptional 4.4% |
| Danes | 100.0 /100 | #4 | Exceptional 4.4% |
| Hmong | 100.0 /100 | #5 | Exceptional 4.4% |
| Swedes | 100.0 /100 | #6 | Exceptional 4.4% |
| Chinese | 100.0 /100 | #7 | Exceptional 4.5% |
| Germans | 100.0 /100 | #8 | Exceptional 4.5% |
| Slovenes | 100.0 /100 | #9 | Exceptional 4.5% |
| Swiss | 100.0 /100 | #10 | Exceptional 4.6% |
| Scandinavians | 100.0 /100 | #11 | Exceptional 4.6% |
| Dutch | 100.0 /100 | #12 | Exceptional 4.6% |
| Belgians | 100.0 /100 | #13 | Exceptional 4.6% |
| Finns | 100.0 /100 | #14 | Exceptional 4.6% |
| English | 100.0 /100 | #15 | Exceptional 4.6% |
Demographics Similar to Immigrants from Congo by Female Unemployment
In terms of female unemployment, the demographic groups most similar to Immigrants from Congo are Taiwanese (5.3%, a difference of 0.020%), Nonimmigrants (5.3%, a difference of 0.030%), Laotian (5.3%, a difference of 0.12%), Immigrants from Indonesia (5.3%, a difference of 0.15%), and Immigrants from Ukraine (5.3%, a difference of 0.18%).
| Demographics | Rating | Rank | Female Unemployment |
| Iranians | 50.4 /100 | #173 | Average 5.3% |
| Immigrants | Poland | 50.0 /100 | #174 | Average 5.3% |
| Immigrants | Laos | 47.5 /100 | #175 | Average 5.3% |
| Immigrants | Vietnam | 47.5 /100 | #176 | Average 5.3% |
| Immigrants | Morocco | 47.4 /100 | #177 | Average 5.3% |
| Immigrants | Southern Europe | 46.2 /100 | #178 | Average 5.3% |
| Laotians | 45.1 /100 | #179 | Average 5.3% |
| Immigrants | Congo | 43.1 /100 | #180 | Average 5.3% |
| Taiwanese | 42.7 /100 | #181 | Average 5.3% |
| Immigrants | Nonimmigrants | 42.6 /100 | #182 | Average 5.3% |
| Immigrants | Indonesia | 40.7 /100 | #183 | Average 5.3% |
| Immigrants | Ukraine | 40.1 /100 | #184 | Average 5.3% |
| Malaysians | 40.1 /100 | #185 | Average 5.3% |
| Immigrants | Belarus | 39.4 /100 | #186 | Fair 5.3% |
| Immigrants | Albania | 35.4 /100 | #187 | Fair 5.3% |