Hmong vs Eastern European Female Unemployment

COMPARE

Hmong
Race
Ancestry
AfghanAfricanAlaska NativeAlaskan AthabascanAlbanianAleutAlsatianAmericanApacheArabArapahoArgentineanArmenianAssyrian/Chaldean/SyriacAustralianAustrianBahamianBangladeshiBarbadianBasqueBelgianBelizeanBermudanBhutaneseBlackfeetBolivianBrazilianBritishBritish West IndianBulgarianBurmeseCajunCambodianCanadianCape VerdeanCarpatho RusynCelticCentral AmericanCentral American IndianCherokeeCheyenneChickasawChileanChineseChippewaChoctawColombianColvilleComancheCosta RicanCreeCreekCroatianCrowCubanCypriotCzechCzechoslovakianDanishDelawareDominicanDutchDutch West IndianEcuadorianEgyptianEnglishEstonianEthiopianEuropeanFijianFilipinoFinnishFrenchFrench American IndianFrench CanadianGermanGerman RussianGhanaianGreekGuamanian/ChamorroGuatemalanGuyaneseHaitianHmongHonduranHopiHoumaHungarianIcelanderIndian (Asian)IndonesianInupiatIranianIraqiIrishIroquoisIsraeliItalianJamaicanJapaneseJordanianKenyanKiowaKoreanLaotianLatvianLebaneseLiberianLithuanianLumbeeLuxembourgerMacedonianMalaysianMalteseMarshalleseMenomineeMexicanMexican American IndianMongolianMoroccanNative HawaiianNavajoNepaleseNew ZealanderNicaraguanNigerianNorthern EuropeanNorwegianOkinawanOsageOttawaPaiutePakistaniPalestinianPanamanianParaguayanPennsylvania GermanPeruvianPimaPolishPortuguesePotawatomiPuebloPuerto RicanPuget Sound SalishRomanianRussianSalvadoranSamoanScandinavianScotch-IrishScottishSeminoleSenegaleseSerbianShoshoneSierra LeoneanSiouxSlavicSlovakSloveneSomaliSouth AfricanSouth AmericanSouth American IndianSoviet UnionSpaniardSpanishSpanish AmericanSpanish American IndianSri LankanSubsaharan AfricanSudaneseSwedishSwissSyrianTaiwaneseThaiTlingit-HaidaTohono O'OdhamTonganTrinidadian and TobagonianTsimshianTurkishU.S. Virgin IslanderUgandanUkrainianUruguayanUteVenezuelanVietnameseWelshWest IndianYakamaYaquiYugoslavianYumanYup'ikZimbabwean
Immigration
NonimmigrantsImmigrantsAfghanistanAfricaAlbaniaArgentinaArmeniaAsiaAustraliaAustriaBahamasBangladeshBarbadosBelarusBelgiumBelizeBoliviaBosnia and HerzegovinaBrazilBulgariaBurma/MyanmarCabo VerdeCambodiaCameroonCanadaCaribbeanCentral AmericaChileChinaColombiaCongoCosta RicaCroatiaCubaCzechoslovakiaDenmarkDominicaDominican RepublicEastern AfricaEastern AsiaEastern EuropeEcuadorEgyptEl SalvadorEnglandEritreaEthiopiaEuropeFijiFranceGermanyGhanaGreeceGrenadaGuatemalaGuyanaHaitiHondurasHong KongHungaryIndiaIndonesiaIranIraqIrelandIsraelItalyJamaicaJapanJordanKazakhstanKenyaKoreaKuwaitLaosLatin AmericaLatviaLebanonLiberiaLithuaniaMalaysiaMexicoMicronesiaMiddle AfricaMoldovaMoroccoNepalNetherlandsNicaraguaNigeriaNorth AmericaNorth MacedoniaNorthern AfricaNorthern EuropeNorwayOceaniaPakistanPanamaPeruPhilippinesPolandPortugalRomaniaRussiaSaudi ArabiaScotlandSenegalSerbiaSierra LeoneSingaporeSomaliaSouth AfricaSouth AmericaSouth Central AsiaSouth Eastern AsiaSouthern EuropeSpainSri LankaSt. Vincent and the GrenadinesSudanSwedenSwitzerlandSyriaTaiwanThailandTrinidad and TobagoTurkeyUgandaUkraineUruguayUzbekistanVenezuelaVietnamWest IndiesWestern AfricaWestern AsiaWestern EuropeYemenZaireZimbabweAzores
Eastern European
Race
Ancestry
AfghanAfricanAlaska NativeAlaskan AthabascanAlbanianAleutAlsatianAmericanApacheArabArapahoArgentineanArmenianAssyrian/Chaldean/SyriacAustralianAustrianBahamianBangladeshiBarbadianBasqueBelgianBelizeanBermudanBhutaneseBlackfeetBolivianBrazilianBritishBritish West IndianBulgarianBurmeseCajunCambodianCanadianCape VerdeanCarpatho RusynCelticCentral AmericanCentral American IndianCherokeeCheyenneChickasawChileanChineseChippewaChoctawColombianColvilleComancheCosta RicanCreeCreekCroatianCrowCubanCypriotCzechCzechoslovakianDanishDelawareDominicanDutchDutch West IndianEastern EuropeanEcuadorianEgyptianEnglishEstonianEthiopianEuropeanFijianFilipinoFinnishFrenchFrench American IndianFrench CanadianGermanGerman RussianGhanaianGreekGuamanian/ChamorroGuatemalanGuyaneseHaitianHonduranHopiHoumaHungarianIcelanderIndian (Asian)IndonesianInupiatIranianIraqiIrishIroquoisIsraeliItalianJamaicanJapaneseJordanianKenyanKiowaKoreanLaotianLatvianLebaneseLiberianLithuanianLumbeeLuxembourgerMacedonianMalaysianMalteseMarshalleseMenomineeMexicanMexican American IndianMongolianMoroccanNative HawaiianNavajoNepaleseNew ZealanderNicaraguanNigerianNorthern EuropeanNorwegianOkinawanOsageOttawaPaiutePakistaniPalestinianPanamanianParaguayanPennsylvania GermanPeruvianPimaPolishPortuguesePotawatomiPuebloPuerto RicanPuget Sound SalishRomanianRussianSalvadoranSamoanScandinavianScotch-IrishScottishSeminoleSenegaleseSerbianShoshoneSierra LeoneanSiouxSlavicSlovakSloveneSomaliSouth AfricanSouth AmericanSouth American IndianSoviet UnionSpaniardSpanishSpanish AmericanSpanish American IndianSri LankanSubsaharan AfricanSudaneseSwedishSwissSyrianTaiwaneseThaiTlingit-HaidaTohono O'OdhamTonganTrinidadian and TobagonianTsimshianTurkishU.S. Virgin IslanderUgandanUkrainianUruguayanUteVenezuelanVietnameseWelshWest IndianYakamaYaquiYugoslavianYumanYup'ikZimbabwean
Immigration
NonimmigrantsImmigrantsAfghanistanAfricaAlbaniaArgentinaArmeniaAsiaAustraliaAustriaBahamasBangladeshBarbadosBelarusBelgiumBelizeBoliviaBosnia and HerzegovinaBrazilBulgariaBurma/MyanmarCabo VerdeCambodiaCameroonCanadaCaribbeanCentral AmericaChileChinaColombiaCongoCosta RicaCroatiaCubaCzechoslovakiaDenmarkDominicaDominican RepublicEastern AfricaEastern AsiaEastern EuropeEcuadorEgyptEl SalvadorEnglandEritreaEthiopiaEuropeFijiFranceGermanyGhanaGreeceGrenadaGuatemalaGuyanaHaitiHondurasHong KongHungaryIndiaIndonesiaIranIraqIrelandIsraelItalyJamaicaJapanJordanKazakhstanKenyaKoreaKuwaitLaosLatin AmericaLatviaLebanonLiberiaLithuaniaMalaysiaMexicoMicronesiaMiddle AfricaMoldovaMoroccoNepalNetherlandsNicaraguaNigeriaNorth AmericaNorth MacedoniaNorthern AfricaNorthern EuropeNorwayOceaniaPakistanPanamaPeruPhilippinesPolandPortugalRomaniaRussiaSaudi ArabiaScotlandSenegalSerbiaSierra LeoneSingaporeSomaliaSouth AfricaSouth AmericaSouth Central AsiaSouth Eastern AsiaSouthern EuropeSpainSri LankaSt. Vincent and the GrenadinesSudanSwedenSwitzerlandSyriaTaiwanThailandTrinidad and TobagoTurkeyUgandaUkraineUruguayUzbekistanVenezuelaVietnamWest IndiesWestern AfricaWestern AsiaWestern EuropeYemenZaireZimbabweAzores
Female Unemployment
Income
Poverty
Unemployment
Labor Participation
Family Structure
Vehicle Availability
Education Level
Disability

Female Unemployment Comparison

Hmong

Eastern Europeans

Exceptional
Exceptional
4.4%
FEMALE UNEMPLOYMENT
100.0/ 100
METRIC RATING
5th/ 347
METRIC RANK
4.9%
FEMALE UNEMPLOYMENT
99.4/ 100
METRIC RATING
43rd/ 347
METRIC RANK

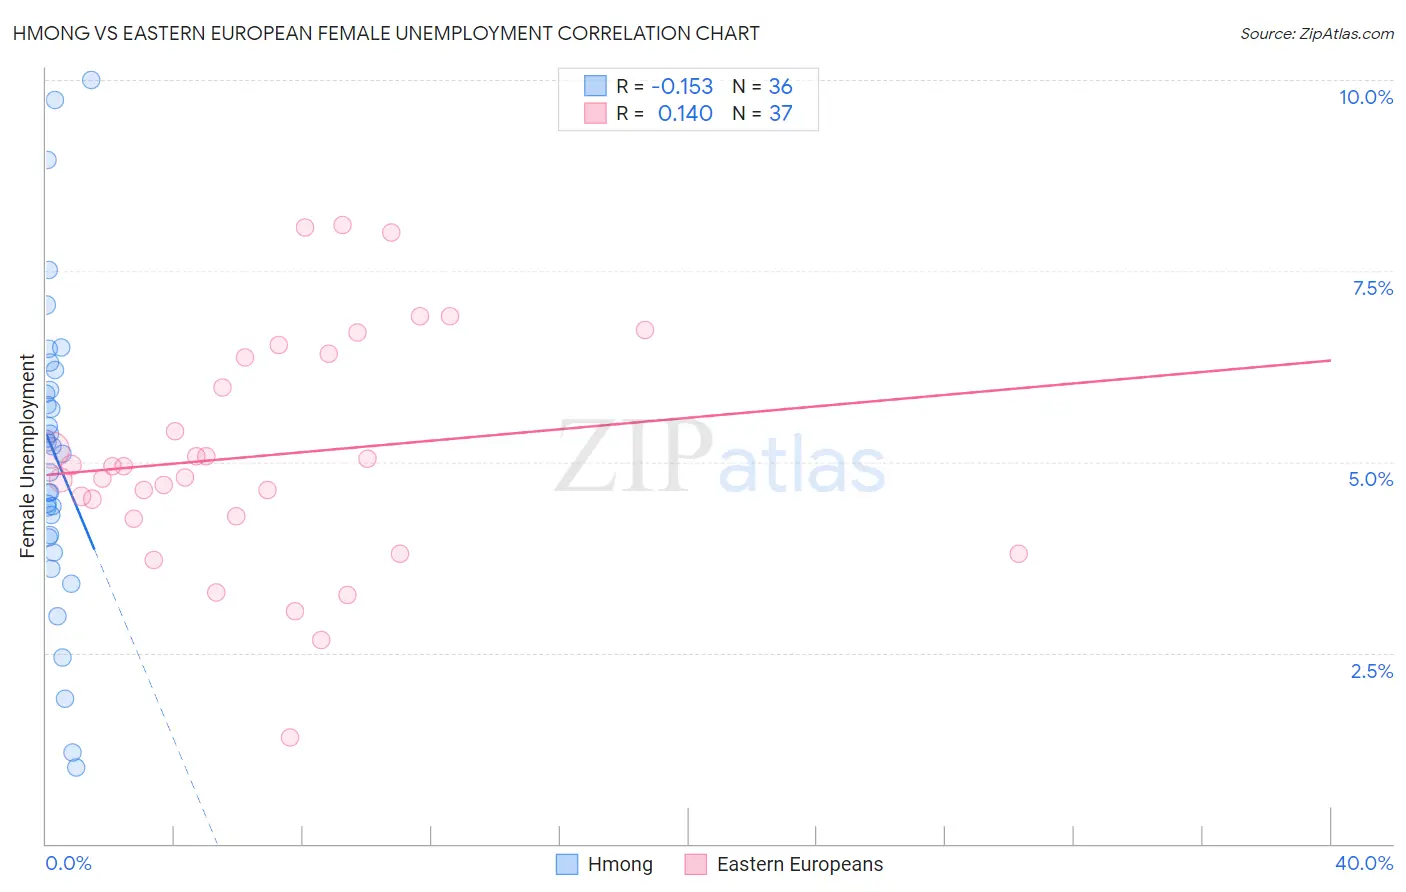
Hmong vs Eastern European Female Unemployment Correlation Chart

The statistical analysis conducted on geographies consisting of 24,652,438 people shows a poor negative correlation between the proportion of Hmong and unemploymnet rate among females in the United States with a correlation coefficient (R) of -0.153 and weighted average of 4.4%. Similarly, the statistical analysis conducted on geographies consisting of 456,874,876 people shows a poor positive correlation between the proportion of Eastern Europeans and unemploymnet rate among females in the United States with a correlation coefficient (R) of 0.140 and weighted average of 4.9%, a difference of 10.4%.
Hmong vs Eastern European Female Unemployment

Female Unemployment Correlation Summary

MeasurementHmongEastern European
Minimum1.0%1.4%
Maximum10.0%8.1%
Range9.0%6.7%
Mean5.1%5.1%
Median5.2%4.9%
Interquartile 25% (IQ1)4.0%4.3%
Interquartile 75% (IQ3)6.1%6.4%
Interquartile Range (IQR)2.0%2.1%
Standard Deviation (Sample)2.0%1.5%
Standard Deviation (Population)2.0%1.5%

Similar Demographics by Female Unemployment

Demographics Similar to Hmong by Female Unemployment

In terms of female unemployment, the demographic groups most similar to Hmong are Danish (4.4%, a difference of 0.11%), Luxembourger (4.4%, a difference of 0.14%), Czech (4.4%, a difference of 0.15%), Swedish (4.4%, a difference of 1.2%), and Chinese (4.5%, a difference of 2.0%).
DemographicsRating | RankFemale Unemployment
Norwegians
100.0
/100
|
#1
Exceptional
4.2%
Czechs
100.0
/100
|
#2
Exceptional
4.4%
Luxembourgers
100.0
/100
|
#3
Exceptional
4.4%
Danes
100.0
/100
|
#4
Exceptional
4.4%
Hmong
100.0
/100
|
#5
Exceptional
4.4%
Swedes
100.0
/100
|
#6
Exceptional
4.4%
Chinese
100.0
/100
|
#7
Exceptional
4.5%
Germans
100.0
/100
|
#8
Exceptional
4.5%
Slovenes
100.0
/100
|
#9
Exceptional
4.5%
Swiss
100.0
/100
|
#10
Exceptional
4.6%
Scandinavians
100.0
/100
|
#11
Exceptional
4.6%
Dutch
100.0
/100
|
#12
Exceptional
4.6%
Belgians
100.0
/100
|
#13
Exceptional
4.6%
Finns
100.0
/100
|
#14
Exceptional
4.6%
English
100.0
/100
|
#15
Exceptional
4.6%

Demographics Similar to Eastern Europeans by Female Unemployment

In terms of female unemployment, the demographic groups most similar to Eastern Europeans are Greek (4.9%, a difference of 0.11%), Italian (4.8%, a difference of 0.17%), Austrian (4.9%, a difference of 0.18%), Immigrants from Bulgaria (4.9%, a difference of 0.21%), and Okinawan (4.9%, a difference of 0.29%).
DemographicsRating | RankFemale Unemployment
Yugoslavians
99.7
/100
|
#36
Exceptional
4.8%
Pennsylvania Germans
99.6
/100
|
#37
Exceptional
4.8%
Northern Europeans
99.6
/100
|
#38
Exceptional
4.8%
Scotch-Irish
99.6
/100
|
#39
Exceptional
4.8%
French
99.6
/100
|
#40
Exceptional
4.8%
Tongans
99.5
/100
|
#41
Exceptional
4.8%
Italians
99.5
/100
|
#42
Exceptional
4.8%
Eastern Europeans
99.4
/100
|
#43
Exceptional
4.9%
Greeks
99.4
/100
|
#44
Exceptional
4.9%
Austrians
99.3
/100
|
#45
Exceptional
4.9%
Immigrants | Bulgaria
99.3
/100
|
#46
Exceptional
4.9%
Okinawans
99.3
/100
|
#47
Exceptional
4.9%
Thais
99.2
/100
|
#48
Exceptional
4.9%
Australians
99.2
/100
|
#49
Exceptional
4.9%
Immigrants | Cuba
99.1
/100
|
#50
Exceptional
4.9%