Haitian vs Vietnamese Female Unemployment
COMPARE
Haitian
Vietnamese
Female Unemployment
Female Unemployment Comparison
Haitians
Vietnamese
6.1%
FEMALE UNEMPLOYMENT
0.0/ 100
METRIC RATING
288th/ 347
METRIC RANK
6.5%
FEMALE UNEMPLOYMENT
0.0/ 100
METRIC RATING
322nd/ 347
METRIC RANK
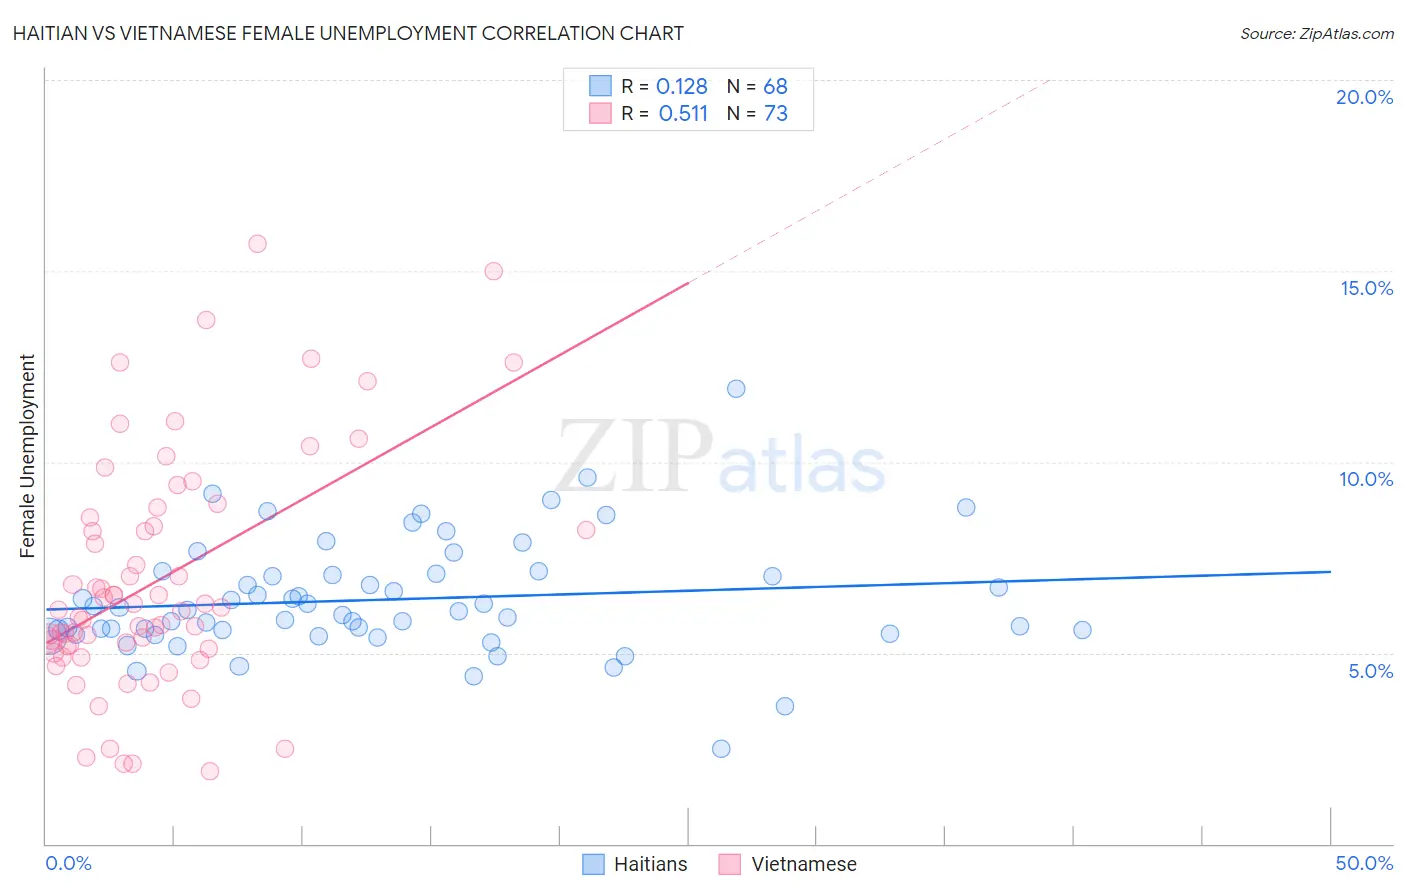
Haitian vs Vietnamese Female Unemployment Correlation Chart
The statistical analysis conducted on geographies consisting of 287,205,640 people shows a poor positive correlation between the proportion of Haitians and unemploymnet rate among females in the United States with a correlation coefficient (R) of 0.128 and weighted average of 6.1%. Similarly, the statistical analysis conducted on geographies consisting of 170,617,487 people shows a substantial positive correlation between the proportion of Vietnamese and unemploymnet rate among females in the United States with a correlation coefficient (R) of 0.511 and weighted average of 6.5%, a difference of 6.7%.
Female Unemployment Correlation Summary
| Measurement | Haitian | Vietnamese |
| Minimum | 2.5% | 1.9% |
| Maximum | 11.9% | 15.7% |
| Range | 9.4% | 13.8% |
| Mean | 6.4% | 6.9% |
| Median | 6.1% | 6.1% |
| Interquartile 25% (IQ1) | 5.5% | 5.1% |
| Interquartile 75% (IQ3) | 7.1% | 8.4% |
| Interquartile Range (IQR) | 1.5% | 3.3% |
| Standard Deviation (Sample) | 1.5% | 3.0% |
| Standard Deviation (Population) | 1.5% | 3.0% |
Similar Demographics by Female Unemployment
Demographics Similar to Haitians by Female Unemployment
In terms of female unemployment, the demographic groups most similar to Haitians are Trinidadian and Tobagonian (6.1%, a difference of 0.010%), Immigrants from Guatemala (6.1%, a difference of 0.040%), Chippewa (6.1%, a difference of 0.070%), Immigrants from Caribbean (6.1%, a difference of 0.070%), and Immigrants from Cabo Verde (6.1%, a difference of 0.10%).
| Demographics | Rating | Rank | Female Unemployment |
| Guatemalans | 0.0 /100 | #281 | Tragic 6.0% |
| Colville | 0.0 /100 | #282 | Tragic 6.0% |
| Salvadorans | 0.0 /100 | #283 | Tragic 6.0% |
| Immigrants | Senegal | 0.0 /100 | #284 | Tragic 6.1% |
| Immigrants | Cabo Verde | 0.0 /100 | #285 | Tragic 6.1% |
| Chippewa | 0.0 /100 | #286 | Tragic 6.1% |
| Immigrants | Guatemala | 0.0 /100 | #287 | Tragic 6.1% |
| Haitians | 0.0 /100 | #288 | Tragic 6.1% |
| Trinidadians and Tobagonians | 0.0 /100 | #289 | Tragic 6.1% |
| Immigrants | Caribbean | 0.0 /100 | #290 | Tragic 6.1% |
| Immigrants | West Indies | 0.0 /100 | #291 | Tragic 6.1% |
| Immigrants | Trinidad and Tobago | 0.0 /100 | #292 | Tragic 6.1% |
| Mexicans | 0.0 /100 | #293 | Tragic 6.1% |
| Immigrants | El Salvador | 0.0 /100 | #294 | Tragic 6.1% |
| Immigrants | Latin America | 0.0 /100 | #295 | Tragic 6.1% |
Demographics Similar to Vietnamese by Female Unemployment
In terms of female unemployment, the demographic groups most similar to Vietnamese are Black/African American (6.5%, a difference of 0.080%), Immigrants from Belize (6.5%, a difference of 0.10%), Immigrants from Dominica (6.5%, a difference of 0.62%), Immigrants from Bangladesh (6.5%, a difference of 0.63%), and British West Indian (6.4%, a difference of 0.82%).
| Demographics | Rating | Rank | Female Unemployment |
| Pueblo | 0.0 /100 | #315 | Tragic 6.4% |
| Houma | 0.0 /100 | #316 | Tragic 6.4% |
| Immigrants | St. Vincent and the Grenadines | 0.0 /100 | #317 | Tragic 6.4% |
| British West Indians | 0.0 /100 | #318 | Tragic 6.4% |
| Immigrants | Bangladesh | 0.0 /100 | #319 | Tragic 6.5% |
| Immigrants | Dominica | 0.0 /100 | #320 | Tragic 6.5% |
| Blacks/African Americans | 0.0 /100 | #321 | Tragic 6.5% |
| Vietnamese | 0.0 /100 | #322 | Tragic 6.5% |
| Immigrants | Belize | 0.0 /100 | #323 | Tragic 6.5% |
| Cheyenne | 0.0 /100 | #324 | Tragic 6.6% |
| Apache | 0.0 /100 | #325 | Tragic 6.6% |
| Natives/Alaskans | 0.0 /100 | #326 | Tragic 6.6% |
| Alaska Natives | 0.0 /100 | #327 | Tragic 6.6% |
| Guyanese | 0.0 /100 | #328 | Tragic 6.7% |
| Immigrants | Guyana | 0.0 /100 | #329 | Tragic 6.7% |