Guamanian/Chamorro vs Black/African American Unemployment Among Ages 60 to 64 years
COMPARE
Guamanian/Chamorro
Black/African American
Unemployment Among Ages 60 to 64 years
Unemployment Among Ages 60 to 64 years Comparison
Guamanians/Chamorros
Blacks/African Americans
4.9%
UNEMPLOYMENT AMONG AGES 60 TO 64 YEARS
23.7/ 100
METRIC RATING
198th/ 347
METRIC RANK
5.3%
UNEMPLOYMENT AMONG AGES 60 TO 64 YEARS
0.0/ 100
METRIC RATING
294th/ 347
METRIC RANK
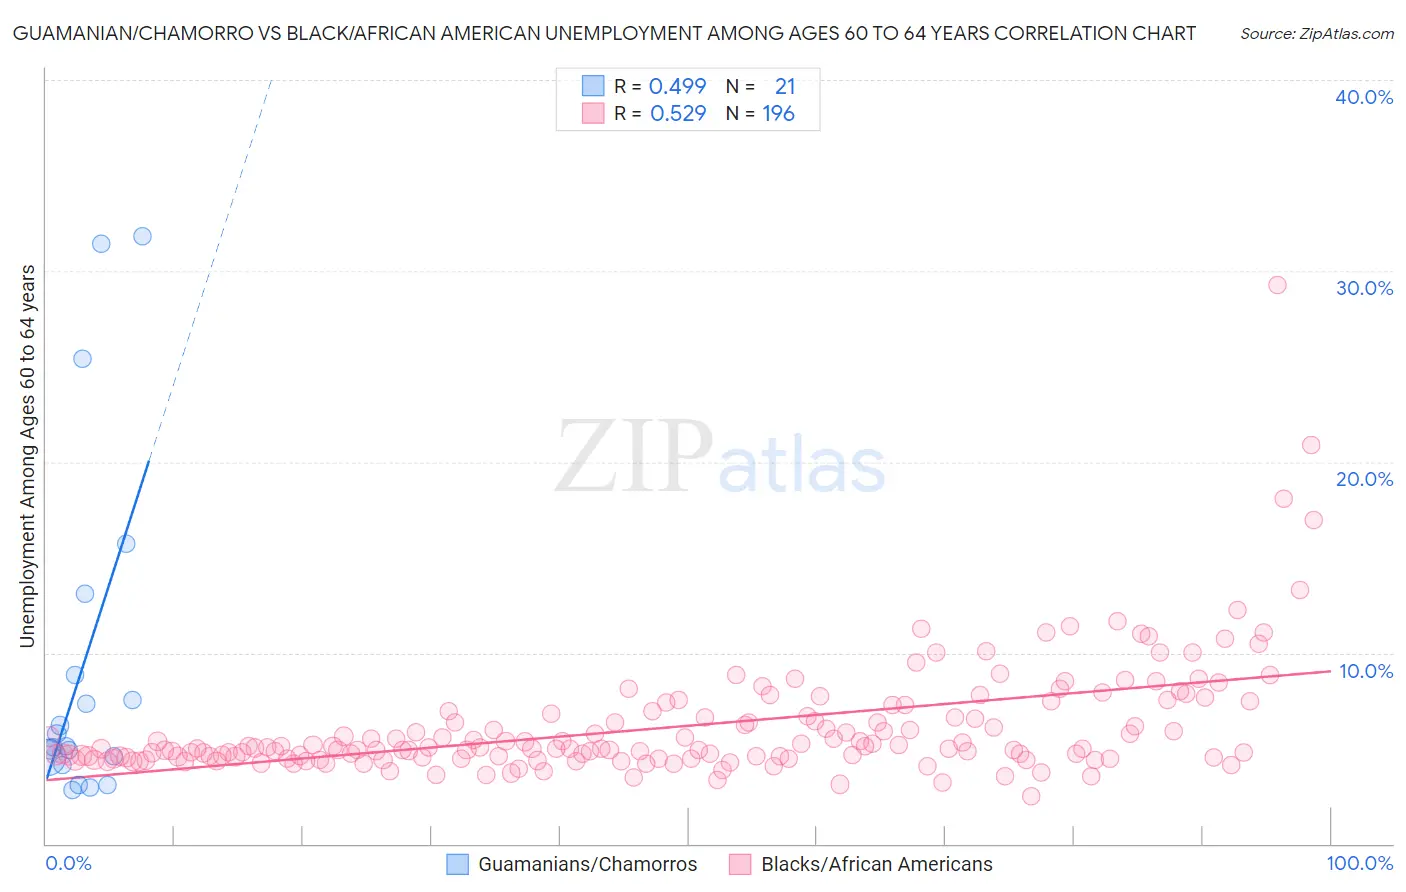
Guamanian/Chamorro vs Black/African American Unemployment Among Ages 60 to 64 years Correlation Chart
The statistical analysis conducted on geographies consisting of 209,235,205 people shows a moderate positive correlation between the proportion of Guamanians/Chamorros and unemployment rate among population between the ages 60 and 64 in the United States with a correlation coefficient (R) of 0.499 and weighted average of 4.9%. Similarly, the statistical analysis conducted on geographies consisting of 465,577,423 people shows a substantial positive correlation between the proportion of Blacks/African Americans and unemployment rate among population between the ages 60 and 64 in the United States with a correlation coefficient (R) of 0.529 and weighted average of 5.3%, a difference of 8.4%.
Unemployment Among Ages 60 to 64 years Correlation Summary
| Measurement | Guamanian/Chamorro | Black/African American |
| Minimum | 2.8% | 2.5% |
| Maximum | 31.8% | 29.2% |
| Range | 29.0% | 26.7% |
| Mean | 9.4% | 6.1% |
| Median | 5.1% | 5.0% |
| Interquartile 25% (IQ1) | 4.3% | 4.5% |
| Interquartile 75% (IQ3) | 11.0% | 6.7% |
| Interquartile Range (IQR) | 6.6% | 2.2% |
| Standard Deviation (Sample) | 9.1% | 3.1% |
| Standard Deviation (Population) | 8.8% | 3.1% |
Similar Demographics by Unemployment Among Ages 60 to 64 years
Demographics Similar to Guamanians/Chamorros by Unemployment Among Ages 60 to 64 years
In terms of unemployment among ages 60 to 64 years, the demographic groups most similar to Guamanians/Chamorros are Immigrants from Vietnam (4.9%, a difference of 0.0%), Immigrants from Czechoslovakia (4.9%, a difference of 0.010%), Colombian (4.9%, a difference of 0.050%), Immigrants from Eastern Europe (4.9%, a difference of 0.070%), and Immigrants from Asia (4.9%, a difference of 0.090%).
| Demographics | Rating | Rank | Unemployment Among Ages 60 to 64 years |
| Immigrants | Nigeria | 29.6 /100 | #191 | Fair 4.9% |
| Menominee | 28.8 /100 | #192 | Fair 4.9% |
| Houma | 28.3 /100 | #193 | Fair 4.9% |
| Immigrants | Colombia | 26.8 /100 | #194 | Fair 4.9% |
| Immigrants | Austria | 26.6 /100 | #195 | Fair 4.9% |
| Immigrants | Asia | 25.7 /100 | #196 | Fair 4.9% |
| Immigrants | Eastern Europe | 25.2 /100 | #197 | Fair 4.9% |
| Guamanians/Chamorros | 23.7 /100 | #198 | Fair 4.9% |
| Immigrants | Vietnam | 23.7 /100 | #199 | Fair 4.9% |
| Immigrants | Czechoslovakia | 23.5 /100 | #200 | Fair 4.9% |
| Colombians | 22.7 /100 | #201 | Fair 4.9% |
| Immigrants | Western Africa | 20.6 /100 | #202 | Fair 4.9% |
| Uruguayans | 19.9 /100 | #203 | Poor 4.9% |
| Russians | 18.9 /100 | #204 | Poor 4.9% |
| Immigrants | Indonesia | 17.4 /100 | #205 | Poor 4.9% |
Demographics Similar to Blacks/African Americans by Unemployment Among Ages 60 to 64 years
In terms of unemployment among ages 60 to 64 years, the demographic groups most similar to Blacks/African Americans are Armenian (5.3%, a difference of 0.030%), Immigrants from Israel (5.3%, a difference of 0.11%), Immigrants from Latin America (5.3%, a difference of 0.13%), Hispanic or Latino (5.3%, a difference of 0.15%), and Jamaican (5.3%, a difference of 0.15%).
| Demographics | Rating | Rank | Unemployment Among Ages 60 to 64 years |
| Salvadorans | 0.0 /100 | #287 | Tragic 5.3% |
| Trinidadians and Tobagonians | 0.0 /100 | #288 | Tragic 5.3% |
| Spanish Americans | 0.0 /100 | #289 | Tragic 5.3% |
| Immigrants | Trinidad and Tobago | 0.0 /100 | #290 | Tragic 5.3% |
| Hispanics or Latinos | 0.0 /100 | #291 | Tragic 5.3% |
| Immigrants | Latin America | 0.0 /100 | #292 | Tragic 5.3% |
| Immigrants | Israel | 0.0 /100 | #293 | Tragic 5.3% |
| Blacks/African Americans | 0.0 /100 | #294 | Tragic 5.3% |
| Armenians | 0.0 /100 | #295 | Tragic 5.3% |
| Jamaicans | 0.0 /100 | #296 | Tragic 5.3% |
| Osage | 0.0 /100 | #297 | Tragic 5.4% |
| Immigrants | Central America | 0.0 /100 | #298 | Tragic 5.4% |
| Immigrants | El Salvador | 0.0 /100 | #299 | Tragic 5.4% |
| Immigrants | Barbados | 0.0 /100 | #300 | Tragic 5.4% |
| Immigrants | Jamaica | 0.0 /100 | #301 | Tragic 5.4% |