Guamanian/Chamorro vs Black/African American In Labor Force | Age 35-44
COMPARE
Guamanian/Chamorro
Black/African American
In Labor Force | Age 35-44
In Labor Force | Age 35-44 Comparison
Guamanians/Chamorros
Blacks/African Americans
83.4%
IN LABOR FORCE | AGE 35-44
0.1/ 100
METRIC RATING
267th/ 347
METRIC RANK
82.2%
IN LABOR FORCE | AGE 35-44
0.0/ 100
METRIC RATING
306th/ 347
METRIC RANK
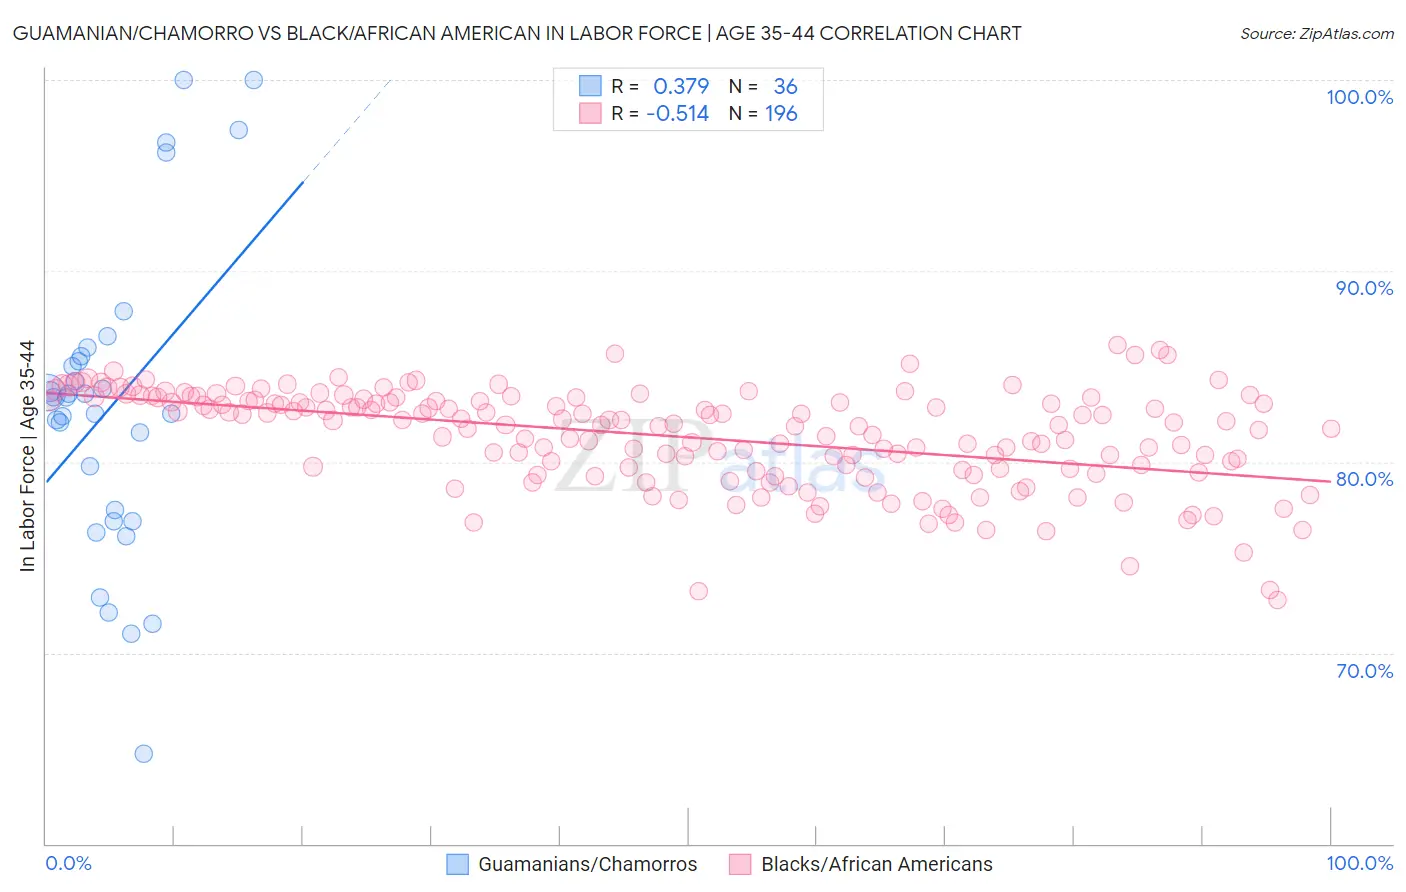
Guamanian/Chamorro vs Black/African American In Labor Force | Age 35-44 Correlation Chart
The statistical analysis conducted on geographies consisting of 221,926,114 people shows a mild positive correlation between the proportion of Guamanians/Chamorros and labor force participation rate among population between the ages 35 and 44 in the United States with a correlation coefficient (R) of 0.379 and weighted average of 83.4%. Similarly, the statistical analysis conducted on geographies consisting of 565,288,812 people shows a substantial negative correlation between the proportion of Blacks/African Americans and labor force participation rate among population between the ages 35 and 44 in the United States with a correlation coefficient (R) of -0.514 and weighted average of 82.2%, a difference of 1.5%.
In Labor Force | Age 35-44 Correlation Summary
| Measurement | Guamanian/Chamorro | Black/African American |
| Minimum | 64.7% | 72.8% |
| Maximum | 100.0% | 86.2% |
| Range | 35.3% | 13.4% |
| Mean | 82.9% | 81.3% |
| Median | 83.4% | 82.0% |
| Interquartile 25% (IQ1) | 77.2% | 79.6% |
| Interquartile 75% (IQ3) | 85.4% | 83.2% |
| Interquartile Range (IQR) | 8.2% | 3.6% |
| Standard Deviation (Sample) | 8.0% | 2.6% |
| Standard Deviation (Population) | 7.9% | 2.6% |
Similar Demographics by In Labor Force | Age 35-44
Demographics Similar to Guamanians/Chamorros by In Labor Force | Age 35-44
In terms of in labor force | age 35-44, the demographic groups most similar to Guamanians/Chamorros are Honduran (83.4%, a difference of 0.030%), Immigrants from Grenada (83.3%, a difference of 0.040%), Spaniard (83.4%, a difference of 0.050%), Central American (83.5%, a difference of 0.080%), and Scotch-Irish (83.5%, a difference of 0.090%).
| Demographics | Rating | Rank | In Labor Force | Age 35-44 |
| Vietnamese | 0.2 /100 | #260 | Tragic 83.5% |
| Immigrants | Dominica | 0.2 /100 | #261 | Tragic 83.5% |
| Immigrants | Congo | 0.2 /100 | #262 | Tragic 83.5% |
| Iroquois | 0.2 /100 | #263 | Tragic 83.5% |
| Scotch-Irish | 0.1 /100 | #264 | Tragic 83.5% |
| Central Americans | 0.1 /100 | #265 | Tragic 83.5% |
| Spaniards | 0.1 /100 | #266 | Tragic 83.4% |
| Guamanians/Chamorros | 0.1 /100 | #267 | Tragic 83.4% |
| Hondurans | 0.1 /100 | #268 | Tragic 83.4% |
| Immigrants | Grenada | 0.1 /100 | #269 | Tragic 83.3% |
| Immigrants | Honduras | 0.0 /100 | #270 | Tragic 83.3% |
| French American Indians | 0.0 /100 | #271 | Tragic 83.2% |
| Immigrants | Fiji | 0.0 /100 | #272 | Tragic 83.2% |
| Spanish | 0.0 /100 | #273 | Tragic 83.2% |
| Immigrants | Nonimmigrants | 0.0 /100 | #274 | Tragic 83.2% |
Demographics Similar to Blacks/African Americans by In Labor Force | Age 35-44
In terms of in labor force | age 35-44, the demographic groups most similar to Blacks/African Americans are Shoshone (82.2%, a difference of 0.020%), Hispanic or Latino (82.1%, a difference of 0.10%), Immigrants from Central America (82.0%, a difference of 0.25%), Cree (82.0%, a difference of 0.25%), and Marshallese (82.4%, a difference of 0.29%).
| Demographics | Rating | Rank | In Labor Force | Age 35-44 |
| Tlingit-Haida | 0.0 /100 | #299 | Tragic 82.5% |
| Central American Indians | 0.0 /100 | #300 | Tragic 82.5% |
| Spanish American Indians | 0.0 /100 | #301 | Tragic 82.5% |
| Americans | 0.0 /100 | #302 | Tragic 82.4% |
| Nepalese | 0.0 /100 | #303 | Tragic 82.4% |
| Marshallese | 0.0 /100 | #304 | Tragic 82.4% |
| Shoshone | 0.0 /100 | #305 | Tragic 82.2% |
| Blacks/African Americans | 0.0 /100 | #306 | Tragic 82.2% |
| Hispanics or Latinos | 0.0 /100 | #307 | Tragic 82.1% |
| Immigrants | Central America | 0.0 /100 | #308 | Tragic 82.0% |
| Cree | 0.0 /100 | #309 | Tragic 82.0% |
| Blackfeet | 0.0 /100 | #310 | Tragic 81.9% |
| Colville | 0.0 /100 | #311 | Tragic 81.7% |
| Alaska Natives | 0.0 /100 | #312 | Tragic 81.6% |
| Mexicans | 0.0 /100 | #313 | Tragic 81.6% |