German vs Immigrants from Ethiopia Male Unemployment

COMPARE

German
Race
Ancestry
AfghanAfricanAlaska NativeAlaskan AthabascanAlbanianAleutAlsatianAmericanApacheArabArapahoArgentineanArmenianAssyrian/Chaldean/SyriacAustralianAustrianBahamianBangladeshiBarbadianBasqueBelgianBelizeanBermudanBhutaneseBlackfeetBolivianBrazilianBritishBritish West IndianBulgarianBurmeseCajunCambodianCanadianCape VerdeanCarpatho RusynCelticCentral AmericanCentral American IndianCherokeeCheyenneChickasawChileanChineseChippewaChoctawColombianColvilleComancheCosta RicanCreeCreekCroatianCrowCubanCypriotCzechCzechoslovakianDanishDelawareDominicanDutchDutch West IndianEastern EuropeanEcuadorianEgyptianEnglishEstonianEthiopianEuropeanFijianFilipinoFinnishFrenchFrench American IndianFrench CanadianGermanGerman RussianGhanaianGreekGuamanian/ChamorroGuatemalanGuyaneseHaitianHmongHonduranHopiHoumaHungarianIcelanderIndian (Asian)IndonesianInupiatIranianIraqiIrishIroquoisIsraeliItalianJamaicanJapaneseJordanianKenyanKiowaKoreanLaotianLatvianLebaneseLiberianLithuanianLumbeeLuxembourgerMacedonianMalaysianMalteseMarshalleseMenomineeMexicanMexican American IndianMongolianMoroccanNative HawaiianNavajoNepaleseNew ZealanderNicaraguanNigerianNorthern EuropeanNorwegianOkinawanOsageOttawaPaiutePakistaniPalestinianPanamanianParaguayanPennsylvania GermanPeruvianPimaPolishPortuguesePotawatomiPuebloPuerto RicanPuget Sound SalishRomanianRussianSalvadoranSamoanScandinavianScotch-IrishScottishSeminoleSenegaleseSerbianShoshoneSierra LeoneanSiouxSlavicSlovakSloveneSomaliSouth AfricanSouth AmericanSouth American IndianSoviet UnionSpaniardSpanishSpanish AmericanSpanish American IndianSri LankanSubsaharan AfricanSudaneseSwedishSwissSyrianTaiwaneseThaiTlingit-HaidaTohono O'OdhamTonganTrinidadian and TobagonianTsimshianTurkishU.S. Virgin IslanderUgandanUkrainianUruguayanUteVenezuelanVietnameseWelshWest IndianYakamaYaquiYugoslavianYumanYup'ikZimbabwean
Immigration
NonimmigrantsImmigrantsAfghanistanAfricaAlbaniaArgentinaArmeniaAsiaAustraliaAustriaBahamasBangladeshBarbadosBelarusBelgiumBelizeBoliviaBosnia and HerzegovinaBrazilBulgariaBurma/MyanmarCabo VerdeCambodiaCameroonCanadaCaribbeanCentral AmericaChileChinaColombiaCongoCosta RicaCroatiaCubaCzechoslovakiaDenmarkDominicaDominican RepublicEastern AfricaEastern AsiaEastern EuropeEcuadorEgyptEl SalvadorEnglandEritreaEuropeFijiFranceGermanyGhanaGreeceGrenadaGuatemalaGuyanaHaitiHondurasHong KongHungaryIndiaIndonesiaIranIraqIrelandIsraelItalyJamaicaJapanJordanKazakhstanKenyaKoreaKuwaitLaosLatin AmericaLatviaLebanonLiberiaLithuaniaMalaysiaMexicoMicronesiaMiddle AfricaMoldovaMoroccoNepalNetherlandsNicaraguaNigeriaNorth AmericaNorth MacedoniaNorthern AfricaNorthern EuropeNorwayOceaniaPakistanPanamaPeruPhilippinesPolandPortugalRomaniaRussiaSaudi ArabiaScotlandSenegalSerbiaSierra LeoneSingaporeSomaliaSouth AfricaSouth AmericaSouth Central AsiaSouth Eastern AsiaSouthern EuropeSpainSri LankaSt. Vincent and the GrenadinesSudanSwedenSwitzerlandSyriaTaiwanThailandTrinidad and TobagoTurkeyUgandaUkraineUruguayUzbekistanVenezuelaVietnamWest IndiesWestern AfricaWestern AsiaWestern EuropeYemenZaireZimbabweAzores
Immigrants from Ethiopia
Race
Ancestry
AfghanAfricanAlaska NativeAlaskan AthabascanAlbanianAleutAlsatianAmericanApacheArabArapahoArgentineanArmenianAssyrian/Chaldean/SyriacAustralianAustrianBahamianBangladeshiBarbadianBasqueBelgianBelizeanBermudanBhutaneseBlackfeetBolivianBrazilianBritishBritish West IndianBulgarianBurmeseCajunCambodianCanadianCape VerdeanCarpatho RusynCelticCentral AmericanCentral American IndianCherokeeCheyenneChickasawChileanChineseChippewaChoctawColombianColvilleComancheCosta RicanCreeCreekCroatianCrowCubanCypriotCzechCzechoslovakianDanishDelawareDominicanDutchDutch West IndianEastern EuropeanEcuadorianEgyptianEnglishEstonianEthiopianEuropeanFijianFilipinoFinnishFrenchFrench American IndianFrench CanadianGerman RussianGhanaianGreekGuamanian/ChamorroGuatemalanGuyaneseHaitianHmongHonduranHopiHoumaHungarianIcelanderIndian (Asian)IndonesianInupiatIranianIraqiIrishIroquoisIsraeliItalianJamaicanJapaneseJordanianKenyanKiowaKoreanLaotianLatvianLebaneseLiberianLithuanianLumbeeLuxembourgerMacedonianMalaysianMalteseMarshalleseMenomineeMexicanMexican American IndianMongolianMoroccanNative HawaiianNavajoNepaleseNew ZealanderNicaraguanNigerianNorthern EuropeanNorwegianOkinawanOsageOttawaPaiutePakistaniPalestinianPanamanianParaguayanPennsylvania GermanPeruvianPimaPolishPortuguesePotawatomiPuebloPuerto RicanPuget Sound SalishRomanianRussianSalvadoranSamoanScandinavianScotch-IrishScottishSeminoleSenegaleseSerbianShoshoneSierra LeoneanSiouxSlavicSlovakSloveneSomaliSouth AfricanSouth AmericanSouth American IndianSoviet UnionSpaniardSpanishSpanish AmericanSpanish American IndianSri LankanSubsaharan AfricanSudaneseSwedishSwissSyrianTaiwaneseThaiTlingit-HaidaTohono O'OdhamTonganTrinidadian and TobagonianTsimshianTurkishU.S. Virgin IslanderUgandanUkrainianUruguayanUteVenezuelanVietnameseWelshWest IndianYakamaYaquiYugoslavianYumanYup'ikZimbabwean
Immigration
NonimmigrantsImmigrantsAfghanistanAfricaAlbaniaArgentinaArmeniaAsiaAustraliaAustriaBahamasBangladeshBarbadosBelarusBelgiumBelizeBoliviaBosnia and HerzegovinaBrazilBulgariaBurma/MyanmarCabo VerdeCambodiaCameroonCanadaCaribbeanCentral AmericaChileChinaColombiaCongoCosta RicaCroatiaCubaCzechoslovakiaDenmarkDominicaDominican RepublicEastern AfricaEastern AsiaEastern EuropeEcuadorEgyptEl SalvadorEnglandEritreaEthiopiaEuropeFijiFranceGermanyGhanaGreeceGrenadaGuatemalaGuyanaHaitiHondurasHong KongHungaryIndiaIndonesiaIranIraqIrelandIsraelItalyJamaicaJapanJordanKazakhstanKenyaKoreaKuwaitLaosLatin AmericaLatviaLebanonLiberiaLithuaniaMalaysiaMexicoMicronesiaMiddle AfricaMoldovaMoroccoNepalNetherlandsNicaraguaNigeriaNorth AmericaNorth MacedoniaNorthern AfricaNorthern EuropeNorwayOceaniaPakistanPanamaPeruPhilippinesPolandPortugalRomaniaRussiaSaudi ArabiaScotlandSenegalSerbiaSierra LeoneSingaporeSomaliaSouth AfricaSouth AmericaSouth Central AsiaSouth Eastern AsiaSouthern EuropeSpainSri LankaSt. Vincent and the GrenadinesSudanSwedenSwitzerlandSyriaTaiwanThailandTrinidad and TobagoTurkeyUgandaUkraineUruguayUzbekistanVenezuelaVietnamWest IndiesWestern AfricaWestern AsiaWestern EuropeYemenZaireZimbabweAzores
Male Unemployment
Income
Poverty
Unemployment
Labor Participation
Family Structure
Vehicle Availability
Education Level
Disability

Male Unemployment Comparison

Germans

Immigrants from Ethiopia

Exceptional
Exceptional
4.7%
MALE UNEMPLOYMENT
100.0/ 100
METRIC RATING
14th/ 347
METRIC RANK
5.1%
MALE UNEMPLOYMENT
91.5/ 100
METRIC RATING
106th/ 347
METRIC RANK

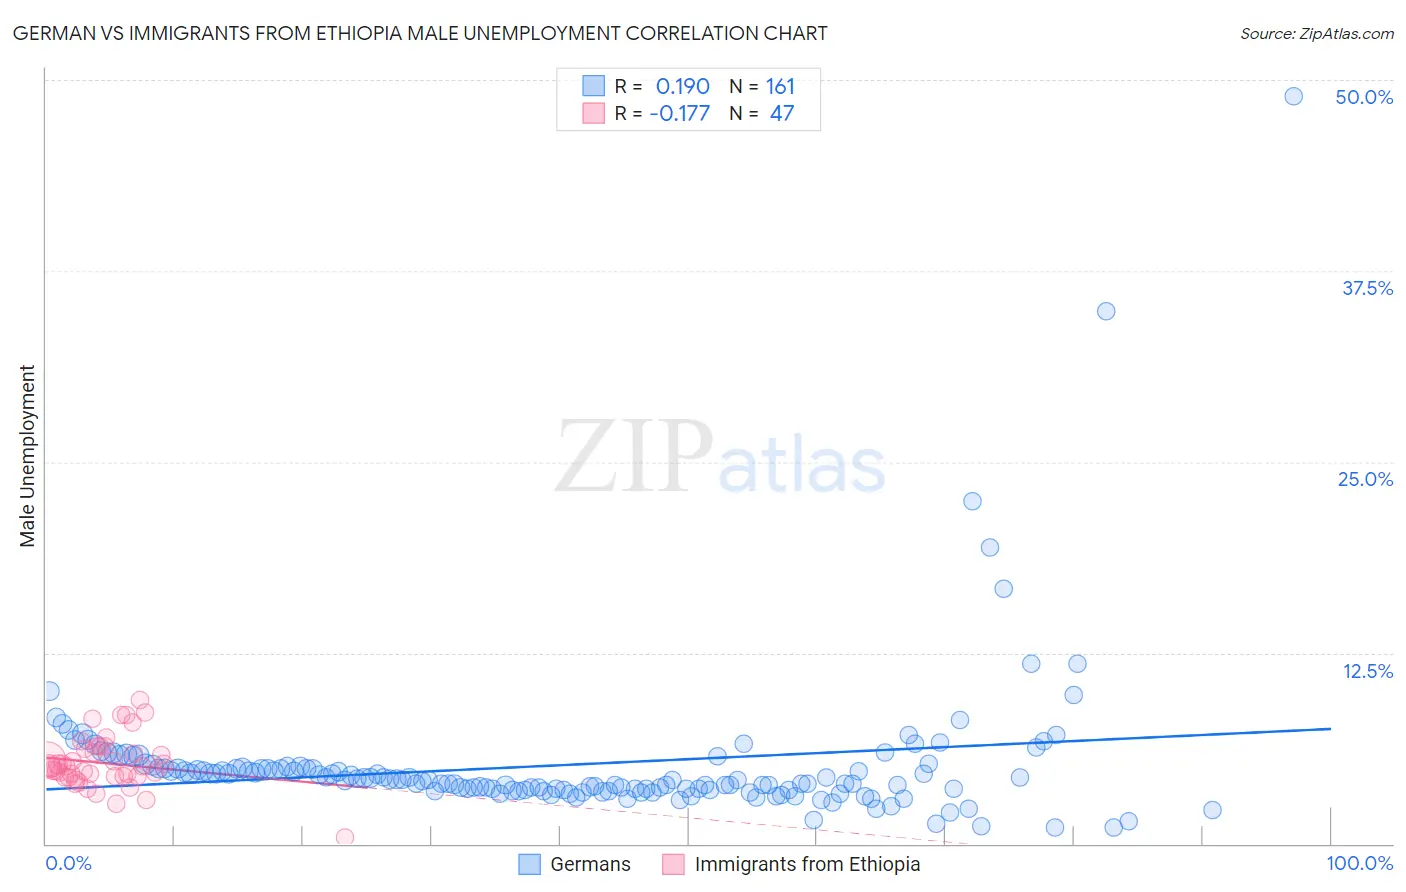
German vs Immigrants from Ethiopia Male Unemployment Correlation Chart

The statistical analysis conducted on geographies consisting of 567,520,747 people shows a poor positive correlation between the proportion of Germans and unemployment rate among males in the United States with a correlation coefficient (R) of 0.190 and weighted average of 4.7%. Similarly, the statistical analysis conducted on geographies consisting of 211,215,885 people shows a poor negative correlation between the proportion of Immigrants from Ethiopia and unemployment rate among males in the United States with a correlation coefficient (R) of -0.177 and weighted average of 5.1%, a difference of 8.9%.
German vs Immigrants from Ethiopia Male Unemployment

Male Unemployment Correlation Summary

MeasurementGermanImmigrants from Ethiopia
Minimum1.1%0.40%
Maximum48.9%9.4%
Range47.8%9.0%
Mean5.2%5.3%
Median4.2%5.1%
Interquartile 25% (IQ1)3.5%4.4%
Interquartile 75% (IQ3)4.9%6.2%
Interquartile Range (IQR)1.4%1.8%
Standard Deviation (Sample)5.0%1.7%
Standard Deviation (Population)5.0%1.7%

Similar Demographics by Male Unemployment

Demographics Similar to Germans by Male Unemployment

In terms of male unemployment, the demographic groups most similar to Germans are Bolivian (4.7%, a difference of 0.020%), Scandinavian (4.7%, a difference of 0.27%), Swiss (4.7%, a difference of 0.32%), Immigrants from Bolivia (4.7%, a difference of 0.70%), and Filipino (4.7%, a difference of 1.1%).
DemographicsRating | RankMale Unemployment
Czechs
100.0
/100
|
#7
Exceptional
4.5%
Luxembourgers
100.0
/100
|
#8
Exceptional
4.5%
Thais
100.0
/100
|
#9
Exceptional
4.6%
Cubans
100.0
/100
|
#10
Exceptional
4.6%
Swedes
100.0
/100
|
#11
Exceptional
4.6%
Immigrants | Bolivia
100.0
/100
|
#12
Exceptional
4.7%
Bolivians
100.0
/100
|
#13
Exceptional
4.7%
Germans
100.0
/100
|
#14
Exceptional
4.7%
Scandinavians
100.0
/100
|
#15
Exceptional
4.7%
Swiss
99.9
/100
|
#16
Exceptional
4.7%
Filipinos
99.9
/100
|
#17
Exceptional
4.7%
English
99.9
/100
|
#18
Exceptional
4.8%
Europeans
99.9
/100
|
#19
Exceptional
4.8%
Pennsylvania Germans
99.9
/100
|
#20
Exceptional
4.8%
Immigrants | Taiwan
99.9
/100
|
#21
Exceptional
4.8%

Demographics Similar to Immigrants from Ethiopia by Male Unemployment

In terms of male unemployment, the demographic groups most similar to Immigrants from Ethiopia are Immigrants from Czechoslovakia (5.1%, a difference of 0.040%), Ethiopian (5.1%, a difference of 0.040%), Immigrants from Chile (5.1%, a difference of 0.050%), Immigrants from Nicaragua (5.1%, a difference of 0.050%), and Immigrants from Jordan (5.1%, a difference of 0.080%).
DemographicsRating | RankMale Unemployment
Uruguayans
93.0
/100
|
#99
Exceptional
5.1%
Russians
92.9
/100
|
#100
Exceptional
5.1%
German Russians
92.7
/100
|
#101
Exceptional
5.1%
Immigrants | France
92.7
/100
|
#102
Exceptional
5.1%
Immigrants | Jordan
91.9
/100
|
#103
Exceptional
5.1%
Immigrants | Chile
91.8
/100
|
#104
Exceptional
5.1%
Immigrants | Czechoslovakia
91.7
/100
|
#105
Exceptional
5.1%
Immigrants | Ethiopia
91.5
/100
|
#106
Exceptional
5.1%
Ethiopians
91.3
/100
|
#107
Exceptional
5.1%
Immigrants | Nicaragua
91.2
/100
|
#108
Exceptional
5.1%
Immigrants | Pakistan
90.9
/100
|
#109
Exceptional
5.1%
Immigrants | England
90.8
/100
|
#110
Exceptional
5.1%
Immigrants | Eastern Asia
90.8
/100
|
#111
Exceptional
5.1%
Immigrants | Moldova
90.3
/100
|
#112
Exceptional
5.1%
Immigrants | Austria
90.3
/100
|
#113
Exceptional
5.1%