German vs Immigrants from Denmark Male Unemployment
COMPARE
German
Immigrants from Denmark
Male Unemployment
Male Unemployment Comparison
Germans
Immigrants from Denmark
4.7%
MALE UNEMPLOYMENT
100.0/ 100
METRIC RATING
14th/ 347
METRIC RANK
5.1%
MALE UNEMPLOYMENT
89.4/ 100
METRIC RATING
116th/ 347
METRIC RANK
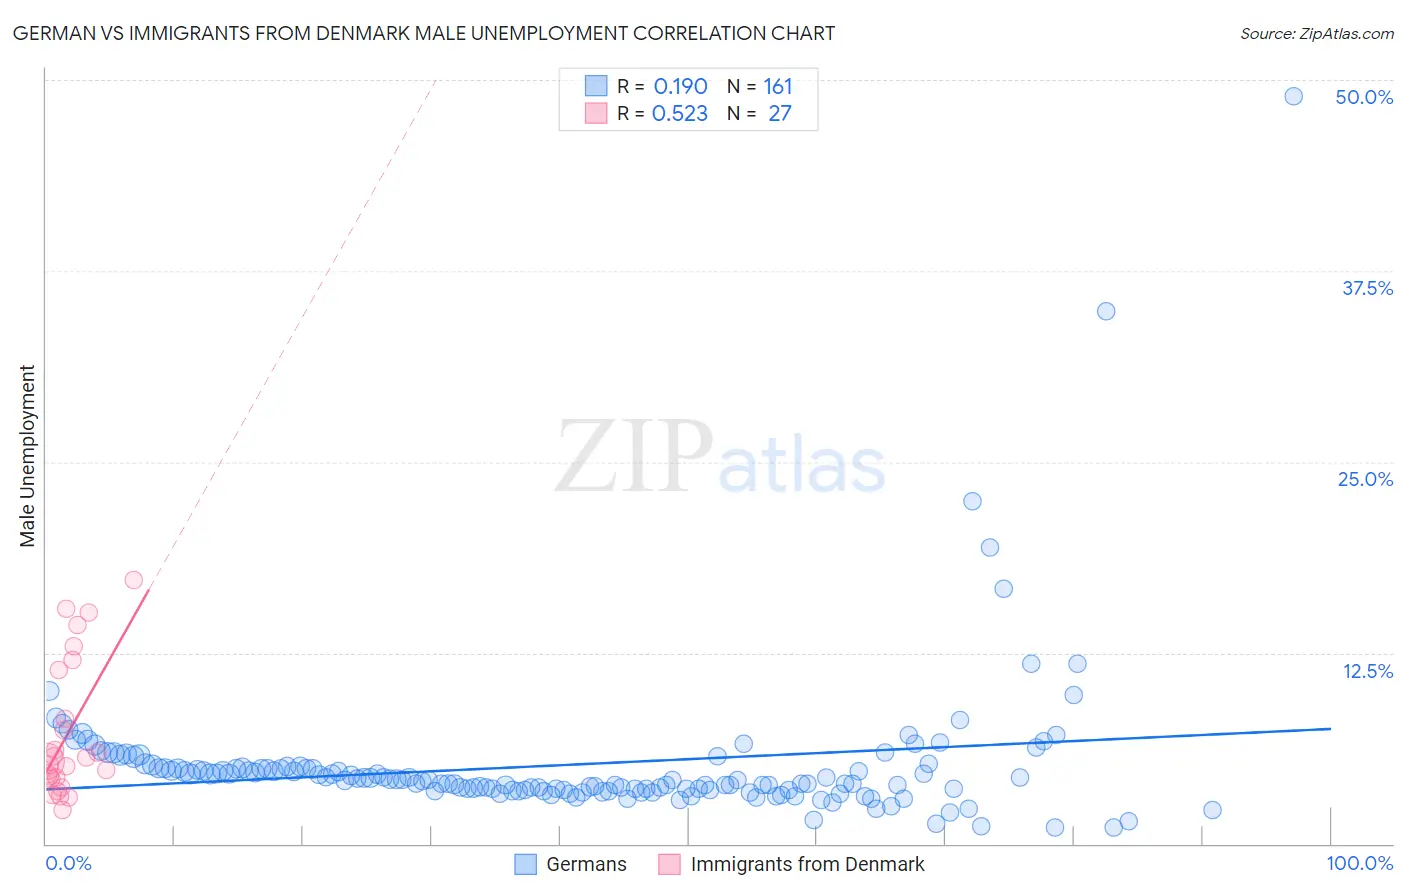
German vs Immigrants from Denmark Male Unemployment Correlation Chart
The statistical analysis conducted on geographies consisting of 567,520,747 people shows a poor positive correlation between the proportion of Germans and unemployment rate among males in the United States with a correlation coefficient (R) of 0.190 and weighted average of 4.7%. Similarly, the statistical analysis conducted on geographies consisting of 136,170,297 people shows a substantial positive correlation between the proportion of Immigrants from Denmark and unemployment rate among males in the United States with a correlation coefficient (R) of 0.523 and weighted average of 5.1%, a difference of 9.3%.
Male Unemployment Correlation Summary
| Measurement | German | Immigrants from Denmark |
| Minimum | 1.1% | 2.2% |
| Maximum | 48.9% | 17.3% |
| Range | 47.8% | 15.1% |
| Mean | 5.2% | 7.2% |
| Median | 4.2% | 5.4% |
| Interquartile 25% (IQ1) | 3.5% | 4.3% |
| Interquartile 75% (IQ3) | 4.9% | 11.4% |
| Interquartile Range (IQR) | 1.4% | 7.1% |
| Standard Deviation (Sample) | 5.0% | 4.4% |
| Standard Deviation (Population) | 5.0% | 4.4% |
Similar Demographics by Male Unemployment
Demographics Similar to Germans by Male Unemployment
In terms of male unemployment, the demographic groups most similar to Germans are Bolivian (4.7%, a difference of 0.020%), Scandinavian (4.7%, a difference of 0.27%), Swiss (4.7%, a difference of 0.32%), Immigrants from Bolivia (4.7%, a difference of 0.70%), and Filipino (4.7%, a difference of 1.1%).
| Demographics | Rating | Rank | Male Unemployment |
| Czechs | 100.0 /100 | #7 | Exceptional 4.5% |
| Luxembourgers | 100.0 /100 | #8 | Exceptional 4.5% |
| Thais | 100.0 /100 | #9 | Exceptional 4.6% |
| Cubans | 100.0 /100 | #10 | Exceptional 4.6% |
| Swedes | 100.0 /100 | #11 | Exceptional 4.6% |
| Immigrants | Bolivia | 100.0 /100 | #12 | Exceptional 4.7% |
| Bolivians | 100.0 /100 | #13 | Exceptional 4.7% |
| Germans | 100.0 /100 | #14 | Exceptional 4.7% |
| Scandinavians | 100.0 /100 | #15 | Exceptional 4.7% |
| Swiss | 99.9 /100 | #16 | Exceptional 4.7% |
| Filipinos | 99.9 /100 | #17 | Exceptional 4.7% |
| English | 99.9 /100 | #18 | Exceptional 4.8% |
| Europeans | 99.9 /100 | #19 | Exceptional 4.8% |
| Pennsylvania Germans | 99.9 /100 | #20 | Exceptional 4.8% |
| Immigrants | Taiwan | 99.9 /100 | #21 | Exceptional 4.8% |
Demographics Similar to Immigrants from Denmark by Male Unemployment
In terms of male unemployment, the demographic groups most similar to Immigrants from Denmark are Immigrants from Asia (5.1%, a difference of 0.040%), Estonian (5.1%, a difference of 0.050%), Romanian (5.1%, a difference of 0.070%), Cypriot (5.1%, a difference of 0.080%), and French Canadian (5.1%, a difference of 0.12%).
| Demographics | Rating | Rank | Male Unemployment |
| Immigrants | Pakistan | 90.9 /100 | #109 | Exceptional 5.1% |
| Immigrants | England | 90.8 /100 | #110 | Exceptional 5.1% |
| Immigrants | Eastern Asia | 90.8 /100 | #111 | Exceptional 5.1% |
| Immigrants | Moldova | 90.3 /100 | #112 | Exceptional 5.1% |
| Immigrants | Austria | 90.3 /100 | #113 | Exceptional 5.1% |
| Romanians | 89.8 /100 | #114 | Excellent 5.1% |
| Immigrants | Asia | 89.6 /100 | #115 | Excellent 5.1% |
| Immigrants | Denmark | 89.4 /100 | #116 | Excellent 5.1% |
| Estonians | 89.0 /100 | #117 | Excellent 5.1% |
| Cypriots | 88.8 /100 | #118 | Excellent 5.1% |
| French Canadians | 88.6 /100 | #119 | Excellent 5.1% |
| Ukrainians | 88.4 /100 | #120 | Excellent 5.1% |
| Mongolians | 88.4 /100 | #121 | Excellent 5.1% |
| Nicaraguans | 88.2 /100 | #122 | Excellent 5.1% |
| Palestinians | 87.7 /100 | #123 | Excellent 5.1% |