Dutch West Indian vs Immigrants from Cuba Unemployment Among Ages 16 to 19 years
COMPARE
Dutch West Indian
Immigrants from Cuba
Unemployment Among Ages 16 to 19 years
Unemployment Among Ages 16 to 19 years Comparison
Dutch West Indians
Immigrants from Cuba
19.7%
UNEMPLOYMENT AMONG AGES 16 TO 19 YEARS
0.0/ 100
METRIC RATING
282nd/ 347
METRIC RANK
16.6%
UNEMPLOYMENT AMONG AGES 16 TO 19 YEARS
99.2/ 100
METRIC RATING
61st/ 347
METRIC RANK
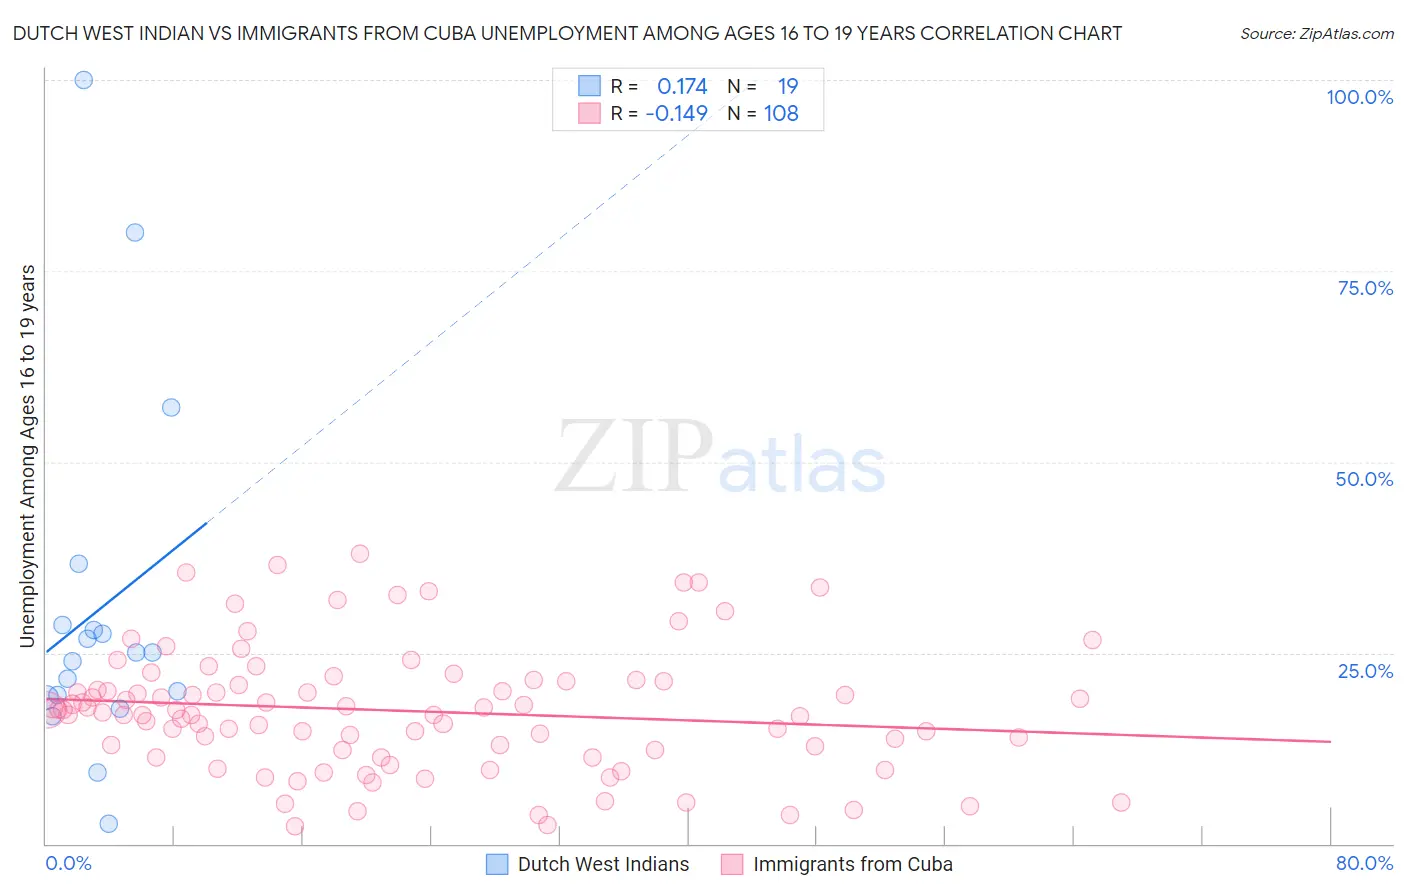
Dutch West Indian vs Immigrants from Cuba Unemployment Among Ages 16 to 19 years Correlation Chart
The statistical analysis conducted on geographies consisting of 83,455,822 people shows a poor positive correlation between the proportion of Dutch West Indians and unemployment rate among population between the ages 16 and 19 in the United States with a correlation coefficient (R) of 0.174 and weighted average of 19.7%. Similarly, the statistical analysis conducted on geographies consisting of 311,938,164 people shows a poor negative correlation between the proportion of Immigrants from Cuba and unemployment rate among population between the ages 16 and 19 in the United States with a correlation coefficient (R) of -0.149 and weighted average of 16.6%, a difference of 19.0%.
Unemployment Among Ages 16 to 19 years Correlation Summary
| Measurement | Dutch West Indian | Immigrants from Cuba |
| Minimum | 2.7% | 2.3% |
| Maximum | 100.0% | 38.0% |
| Range | 97.3% | 35.7% |
| Mean | 30.8% | 17.4% |
| Median | 25.0% | 17.4% |
| Interquartile 25% (IQ1) | 19.2% | 12.3% |
| Interquartile 75% (IQ3) | 28.6% | 21.2% |
| Interquartile Range (IQR) | 9.4% | 9.0% |
| Standard Deviation (Sample) | 23.8% | 8.1% |
| Standard Deviation (Population) | 23.1% | 8.0% |
Similar Demographics by Unemployment Among Ages 16 to 19 years
Demographics Similar to Dutch West Indians by Unemployment Among Ages 16 to 19 years
In terms of unemployment among ages 16 to 19 years, the demographic groups most similar to Dutch West Indians are Sioux (19.7%, a difference of 0.050%), Sierra Leonean (19.7%, a difference of 0.060%), Ghanaian (19.8%, a difference of 0.24%), Bahamian (19.8%, a difference of 0.36%), and Immigrants from Ghana (19.8%, a difference of 0.43%).
| Demographics | Rating | Rank | Unemployment Among Ages 16 to 19 years |
| Paraguayans | 0.0 /100 | #275 | Tragic 19.4% |
| Immigrants | Latin America | 0.0 /100 | #276 | Tragic 19.4% |
| Immigrants | Western Africa | 0.0 /100 | #277 | Tragic 19.4% |
| Africans | 0.0 /100 | #278 | Tragic 19.5% |
| Ute | 0.0 /100 | #279 | Tragic 19.6% |
| Cajuns | 0.0 /100 | #280 | Tragic 19.6% |
| Cypriots | 0.0 /100 | #281 | Tragic 19.6% |
| Dutch West Indians | 0.0 /100 | #282 | Tragic 19.7% |
| Sioux | 0.0 /100 | #283 | Tragic 19.7% |
| Sierra Leoneans | 0.0 /100 | #284 | Tragic 19.7% |
| Ghanaians | 0.0 /100 | #285 | Tragic 19.8% |
| Bahamians | 0.0 /100 | #286 | Tragic 19.8% |
| Immigrants | Ghana | 0.0 /100 | #287 | Tragic 19.8% |
| Immigrants | Azores | 0.0 /100 | #288 | Tragic 19.8% |
| Pueblo | 0.0 /100 | #289 | Tragic 19.8% |
Demographics Similar to Immigrants from Cuba by Unemployment Among Ages 16 to 19 years
In terms of unemployment among ages 16 to 19 years, the demographic groups most similar to Immigrants from Cuba are Menominee (16.6%, a difference of 0.060%), Macedonian (16.6%, a difference of 0.10%), Irish (16.5%, a difference of 0.23%), Immigrants from Uganda (16.5%, a difference of 0.28%), and Scotch-Irish (16.6%, a difference of 0.28%).
| Demographics | Rating | Rank | Unemployment Among Ages 16 to 19 years |
| British | 99.5 /100 | #54 | Exceptional 16.5% |
| Czechoslovakians | 99.5 /100 | #55 | Exceptional 16.5% |
| Sri Lankans | 99.5 /100 | #56 | Exceptional 16.5% |
| Immigrants | Jordan | 99.4 /100 | #57 | Exceptional 16.5% |
| Immigrants | Uganda | 99.4 /100 | #58 | Exceptional 16.5% |
| Irish | 99.4 /100 | #59 | Exceptional 16.5% |
| Menominee | 99.3 /100 | #60 | Exceptional 16.6% |
| Immigrants | Cuba | 99.2 /100 | #61 | Exceptional 16.6% |
| Macedonians | 99.2 /100 | #62 | Exceptional 16.6% |
| Scotch-Irish | 99.1 /100 | #63 | Exceptional 16.6% |
| Northern Europeans | 99.0 /100 | #64 | Exceptional 16.6% |
| Immigrants | Japan | 98.9 /100 | #65 | Exceptional 16.6% |
| Okinawans | 98.9 /100 | #66 | Exceptional 16.6% |
| Slavs | 98.7 /100 | #67 | Exceptional 16.7% |
| Chickasaw | 98.7 /100 | #68 | Exceptional 16.7% |