Dutch West Indian vs Immigrants from Cuba Child Poverty Under the Age of 16
COMPARE
Dutch West Indian
Immigrants from Cuba
Child Poverty Under the Age of 16
Child Poverty Under the Age of 16 Comparison
Dutch West Indians
Immigrants from Cuba
21.5%
CHILD POVERTY UNDER THE AGE OF 16
0.0/ 100
METRIC RATING
311th/ 347
METRIC RANK
18.7%
CHILD POVERTY UNDER THE AGE OF 16
0.6/ 100
METRIC RATING
243rd/ 347
METRIC RANK
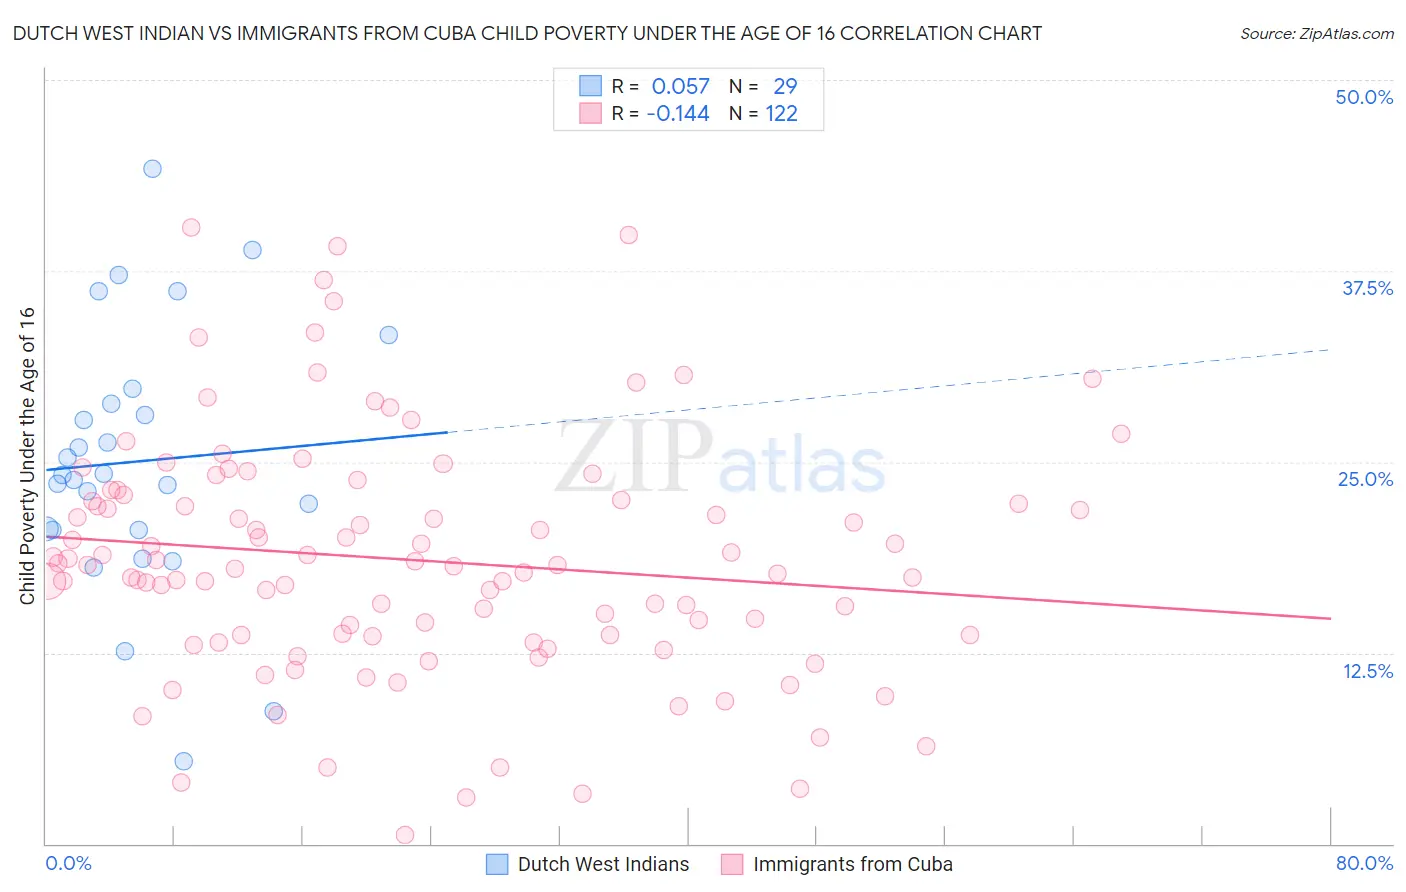
Dutch West Indian vs Immigrants from Cuba Child Poverty Under the Age of 16 Correlation Chart
The statistical analysis conducted on geographies consisting of 85,708,434 people shows a slight positive correlation between the proportion of Dutch West Indians and poverty level among children under the age of 16 in the United States with a correlation coefficient (R) of 0.057 and weighted average of 21.5%. Similarly, the statistical analysis conducted on geographies consisting of 323,831,024 people shows a poor negative correlation between the proportion of Immigrants from Cuba and poverty level among children under the age of 16 in the United States with a correlation coefficient (R) of -0.144 and weighted average of 18.7%, a difference of 14.9%.
Child Poverty Under the Age of 16 Correlation Summary
| Measurement | Dutch West Indian | Immigrants from Cuba |
| Minimum | 5.4% | 0.61% |
| Maximum | 44.2% | 40.4% |
| Range | 38.8% | 39.8% |
| Mean | 25.0% | 18.6% |
| Median | 24.1% | 18.2% |
| Interquartile 25% (IQ1) | 20.5% | 13.6% |
| Interquartile 75% (IQ3) | 29.3% | 22.5% |
| Interquartile Range (IQR) | 8.8% | 8.9% |
| Standard Deviation (Sample) | 8.7% | 7.8% |
| Standard Deviation (Population) | 8.5% | 7.8% |
Similar Demographics by Child Poverty Under the Age of 16
Demographics Similar to Dutch West Indians by Child Poverty Under the Age of 16
In terms of child poverty under the age of 16, the demographic groups most similar to Dutch West Indians are Bahamian (21.5%, a difference of 0.090%), Immigrants from Mexico (21.5%, a difference of 0.12%), Ute (21.5%, a difference of 0.25%), Creek (21.5%, a difference of 0.28%), and Immigrants from Somalia (21.6%, a difference of 0.48%).
| Demographics | Rating | Rank | Child Poverty Under the Age of 16 |
| Somalis | 0.0 /100 | #304 | Tragic 21.0% |
| Seminole | 0.0 /100 | #305 | Tragic 21.1% |
| Guatemalans | 0.0 /100 | #306 | Tragic 21.2% |
| Immigrants | Central America | 0.0 /100 | #307 | Tragic 21.3% |
| British West Indians | 0.0 /100 | #308 | Tragic 21.3% |
| Immigrants | Mexico | 0.0 /100 | #309 | Tragic 21.5% |
| Bahamians | 0.0 /100 | #310 | Tragic 21.5% |
| Dutch West Indians | 0.0 /100 | #311 | Tragic 21.5% |
| Ute | 0.0 /100 | #312 | Tragic 21.5% |
| Creek | 0.0 /100 | #313 | Tragic 21.5% |
| Immigrants | Somalia | 0.0 /100 | #314 | Tragic 21.6% |
| Immigrants | Guatemala | 0.0 /100 | #315 | Tragic 21.6% |
| Africans | 0.0 /100 | #316 | Tragic 21.7% |
| Immigrants | Dominica | 0.0 /100 | #317 | Tragic 21.9% |
| U.S. Virgin Islanders | 0.0 /100 | #318 | Tragic 22.0% |
Demographics Similar to Immigrants from Cuba by Child Poverty Under the Age of 16
In terms of child poverty under the age of 16, the demographic groups most similar to Immigrants from Cuba are Cape Verdean (18.7%, a difference of 0.070%), Immigrants from Laos (18.7%, a difference of 0.13%), Alsatian (18.6%, a difference of 0.25%), Ghanaian (18.6%, a difference of 0.71%), and Shoshone (18.8%, a difference of 0.72%).
| Demographics | Rating | Rank | Child Poverty Under the Age of 16 |
| Cree | 0.9 /100 | #236 | Tragic 18.5% |
| Sudanese | 0.9 /100 | #237 | Tragic 18.5% |
| Immigrants | Eritrea | 0.8 /100 | #238 | Tragic 18.5% |
| Immigrants | Sudan | 0.8 /100 | #239 | Tragic 18.5% |
| Ghanaians | 0.8 /100 | #240 | Tragic 18.6% |
| Alsatians | 0.7 /100 | #241 | Tragic 18.6% |
| Immigrants | Laos | 0.6 /100 | #242 | Tragic 18.7% |
| Immigrants | Cuba | 0.6 /100 | #243 | Tragic 18.7% |
| Cape Verdeans | 0.6 /100 | #244 | Tragic 18.7% |
| Shoshone | 0.5 /100 | #245 | Tragic 18.8% |
| Immigrants | Nicaragua | 0.4 /100 | #246 | Tragic 18.8% |
| French American Indians | 0.4 /100 | #247 | Tragic 18.9% |
| Ecuadorians | 0.3 /100 | #248 | Tragic 19.0% |
| Potawatomi | 0.3 /100 | #249 | Tragic 19.0% |
| Immigrants | Middle Africa | 0.3 /100 | #250 | Tragic 19.0% |