Czechoslovakian vs Immigrants from Kazakhstan Unemployment Among Women with Children Under 6 years
COMPARE
Czechoslovakian
Immigrants from Kazakhstan
Unemployment Among Women with Children Under 6 years
Unemployment Among Women with Children Under 6 years Comparison
Czechoslovakians
Immigrants from Kazakhstan
7.7%
UNEMPLOYMENT AMONG WOMEN WITH CHILDREN UNDER 6 YEARS
38.4/ 100
METRIC RATING
188th/ 347
METRIC RANK
7.2%
UNEMPLOYMENT AMONG WOMEN WITH CHILDREN UNDER 6 YEARS
97.1/ 100
METRIC RATING
107th/ 347
METRIC RANK
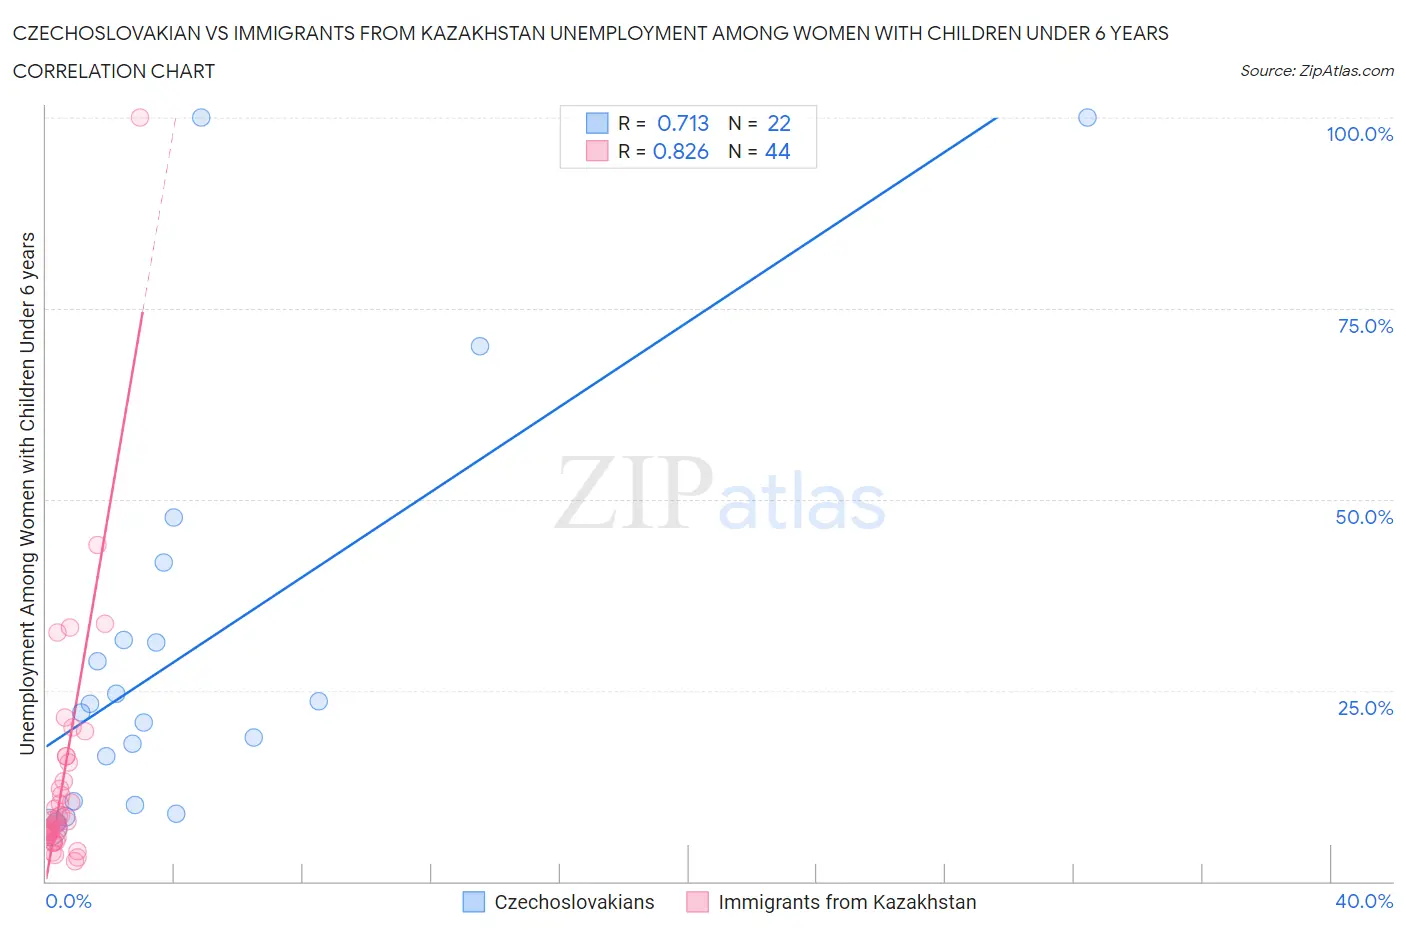
Czechoslovakian vs Immigrants from Kazakhstan Unemployment Among Women with Children Under 6 years Correlation Chart
The statistical analysis conducted on geographies consisting of 272,908,849 people shows a strong positive correlation between the proportion of Czechoslovakians and unemployment rate among women with children under the age of 6 in the United States with a correlation coefficient (R) of 0.713 and weighted average of 7.7%. Similarly, the statistical analysis conducted on geographies consisting of 109,712,077 people shows a very strong positive correlation between the proportion of Immigrants from Kazakhstan and unemployment rate among women with children under the age of 6 in the United States with a correlation coefficient (R) of 0.826 and weighted average of 7.2%, a difference of 7.0%.
Unemployment Among Women with Children Under 6 years Correlation Summary
| Measurement | Czechoslovakian | Immigrants from Kazakhstan |
| Minimum | 7.1% | 2.6% |
| Maximum | 100.0% | 100.0% |
| Range | 92.9% | 97.4% |
| Mean | 30.5% | 13.3% |
| Median | 22.7% | 7.7% |
| Interquartile 25% (IQ1) | 10.5% | 6.0% |
| Interquartile 75% (IQ3) | 31.6% | 14.3% |
| Interquartile Range (IQR) | 21.1% | 8.3% |
| Standard Deviation (Sample) | 27.0% | 16.2% |
| Standard Deviation (Population) | 26.4% | 16.1% |
Similar Demographics by Unemployment Among Women with Children Under 6 years
Demographics Similar to Czechoslovakians by Unemployment Among Women with Children Under 6 years
In terms of unemployment among women with children under 6 years, the demographic groups most similar to Czechoslovakians are Immigrants from Thailand (7.7%, a difference of 0.010%), Yugoslavian (7.7%, a difference of 0.060%), Spanish American (7.7%, a difference of 0.080%), Indonesian (7.7%, a difference of 0.14%), and Immigrants from Panama (7.7%, a difference of 0.20%).
| Demographics | Rating | Rank | Unemployment Among Women with Children Under 6 years |
| Brazilians | 43.9 /100 | #181 | Average 7.7% |
| Nepalese | 43.5 /100 | #182 | Average 7.7% |
| Sierra Leoneans | 42.9 /100 | #183 | Average 7.7% |
| Indonesians | 40.5 /100 | #184 | Average 7.7% |
| Spanish Americans | 39.7 /100 | #185 | Fair 7.7% |
| Yugoslavians | 39.4 /100 | #186 | Fair 7.7% |
| Immigrants | Thailand | 38.5 /100 | #187 | Fair 7.7% |
| Czechoslovakians | 38.4 /100 | #188 | Fair 7.7% |
| Immigrants | Panama | 35.7 /100 | #189 | Fair 7.7% |
| Immigrants | North Macedonia | 34.4 /100 | #190 | Fair 7.7% |
| Immigrants | Austria | 32.4 /100 | #191 | Fair 7.7% |
| Immigrants | Africa | 32.4 /100 | #192 | Fair 7.7% |
| Slavs | 32.4 /100 | #193 | Fair 7.7% |
| Syrians | 31.9 /100 | #194 | Fair 7.7% |
| Malaysians | 31.1 /100 | #195 | Fair 7.7% |
Demographics Similar to Immigrants from Kazakhstan by Unemployment Among Women with Children Under 6 years
In terms of unemployment among women with children under 6 years, the demographic groups most similar to Immigrants from Kazakhstan are Immigrants from Pakistan (7.2%, a difference of 0.020%), Venezuelan (7.2%, a difference of 0.030%), Immigrants from Egypt (7.2%, a difference of 0.040%), Immigrants from Nicaragua (7.2%, a difference of 0.12%), and Immigrants from Saudi Arabia (7.2%, a difference of 0.12%).
| Demographics | Rating | Rank | Unemployment Among Women with Children Under 6 years |
| Immigrants | Northern Europe | 97.4 /100 | #100 | Exceptional 7.2% |
| Chileans | 97.4 /100 | #101 | Exceptional 7.2% |
| Immigrants | Nicaragua | 97.3 /100 | #102 | Exceptional 7.2% |
| Immigrants | Saudi Arabia | 97.3 /100 | #103 | Exceptional 7.2% |
| Immigrants | Egypt | 97.2 /100 | #104 | Exceptional 7.2% |
| Venezuelans | 97.2 /100 | #105 | Exceptional 7.2% |
| Immigrants | Pakistan | 97.2 /100 | #106 | Exceptional 7.2% |
| Immigrants | Kazakhstan | 97.1 /100 | #107 | Exceptional 7.2% |
| Eastern Europeans | 96.9 /100 | #108 | Exceptional 7.2% |
| Australians | 96.9 /100 | #109 | Exceptional 7.2% |
| Palestinians | 96.8 /100 | #110 | Exceptional 7.2% |
| Norwegians | 96.7 /100 | #111 | Exceptional 7.2% |
| Israelis | 96.5 /100 | #112 | Exceptional 7.2% |
| Nicaraguans | 96.3 /100 | #113 | Exceptional 7.2% |
| Argentineans | 96.2 /100 | #114 | Exceptional 7.2% |