Czechoslovakian vs British West Indian Female Unemployment
COMPARE
Czechoslovakian
British West Indian
Female Unemployment
Female Unemployment Comparison
Czechoslovakians
British West Indians
4.8%
FEMALE UNEMPLOYMENT
99.7/ 100
METRIC RATING
33rd/ 347
METRIC RANK
6.4%
FEMALE UNEMPLOYMENT
0.0/ 100
METRIC RATING
318th/ 347
METRIC RANK
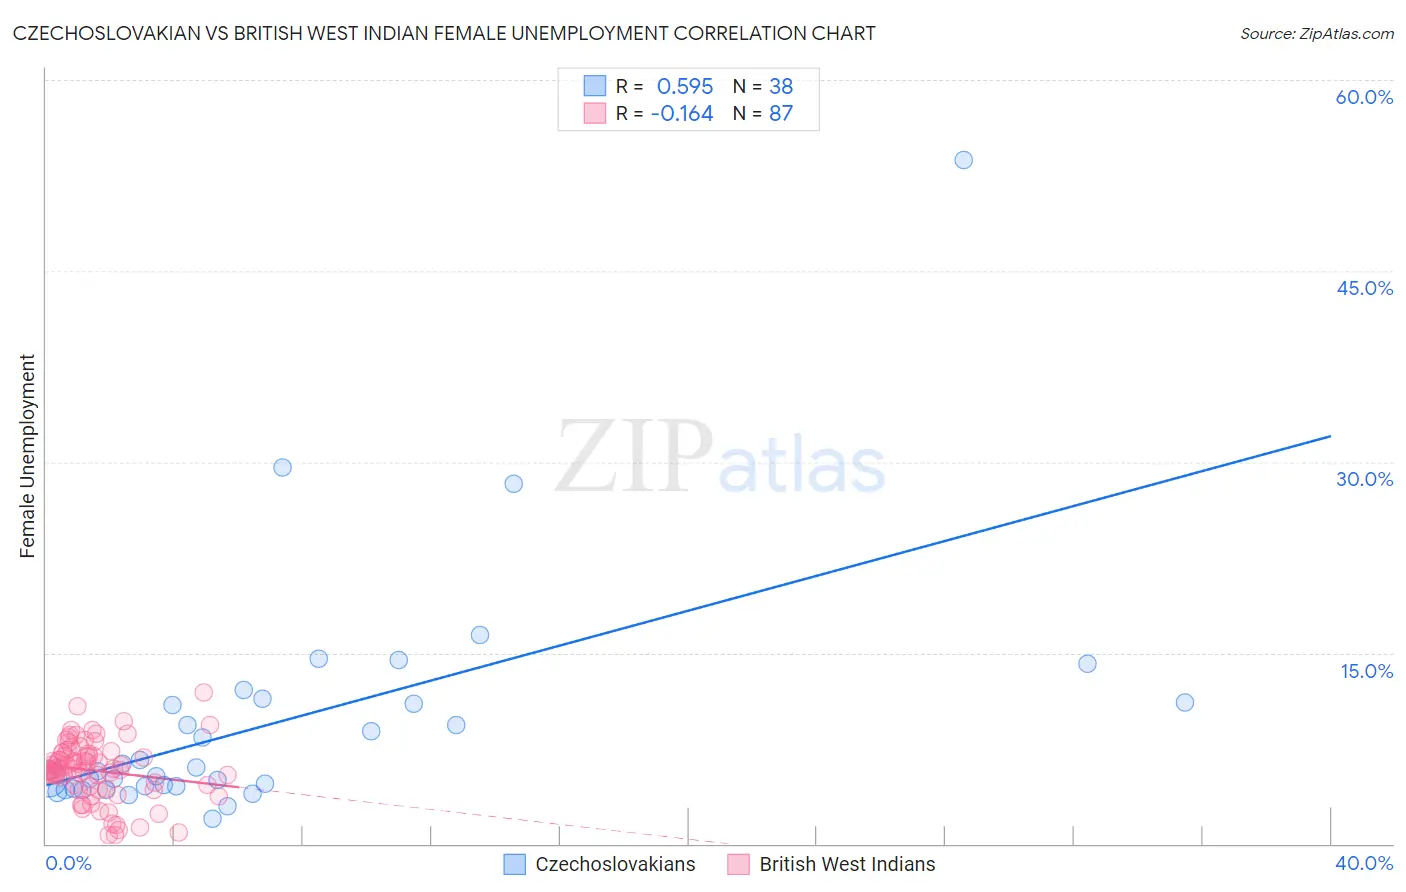
Czechoslovakian vs British West Indian Female Unemployment Correlation Chart
The statistical analysis conducted on geographies consisting of 365,958,591 people shows a substantial positive correlation between the proportion of Czechoslovakians and unemploymnet rate among females in the United States with a correlation coefficient (R) of 0.595 and weighted average of 4.8%. Similarly, the statistical analysis conducted on geographies consisting of 152,545,495 people shows a poor negative correlation between the proportion of British West Indians and unemploymnet rate among females in the United States with a correlation coefficient (R) of -0.164 and weighted average of 6.4%, a difference of 34.6%.
Female Unemployment Correlation Summary
| Measurement | Czechoslovakian | British West Indian |
| Minimum | 1.9% | 0.70% |
| Maximum | 53.7% | 11.9% |
| Range | 51.8% | 11.2% |
| Mean | 9.6% | 5.8% |
| Median | 5.8% | 5.9% |
| Interquartile 25% (IQ1) | 4.5% | 4.5% |
| Interquartile 75% (IQ3) | 11.1% | 7.1% |
| Interquartile Range (IQR) | 6.6% | 2.6% |
| Standard Deviation (Sample) | 9.6% | 2.3% |
| Standard Deviation (Population) | 9.4% | 2.3% |
Similar Demographics by Female Unemployment
Demographics Similar to Czechoslovakians by Female Unemployment
In terms of female unemployment, the demographic groups most similar to Czechoslovakians are Zimbabwean (4.8%, a difference of 0.030%), French Canadian (4.8%, a difference of 0.10%), Yugoslavian (4.8%, a difference of 0.24%), Slovak (4.8%, a difference of 0.51%), and Pennsylvania German (4.8%, a difference of 0.61%).
| Demographics | Rating | Rank | Female Unemployment |
| Immigrants | Bosnia and Herzegovina | 99.9 /100 | #26 | Exceptional 4.7% |
| British | 99.9 /100 | #27 | Exceptional 4.7% |
| Irish | 99.9 /100 | #28 | Exceptional 4.7% |
| Cypriots | 99.9 /100 | #29 | Exceptional 4.7% |
| Lithuanians | 99.8 /100 | #30 | Exceptional 4.7% |
| Sudanese | 99.8 /100 | #31 | Exceptional 4.8% |
| Slovaks | 99.8 /100 | #32 | Exceptional 4.8% |
| Czechoslovakians | 99.7 /100 | #33 | Exceptional 4.8% |
| Zimbabweans | 99.7 /100 | #34 | Exceptional 4.8% |
| French Canadians | 99.7 /100 | #35 | Exceptional 4.8% |
| Yugoslavians | 99.7 /100 | #36 | Exceptional 4.8% |
| Pennsylvania Germans | 99.6 /100 | #37 | Exceptional 4.8% |
| Northern Europeans | 99.6 /100 | #38 | Exceptional 4.8% |
| Scotch-Irish | 99.6 /100 | #39 | Exceptional 4.8% |
| French | 99.6 /100 | #40 | Exceptional 4.8% |
Demographics Similar to British West Indians by Female Unemployment
In terms of female unemployment, the demographic groups most similar to British West Indians are Immigrants from Bangladesh (6.5%, a difference of 0.19%), Immigrants from Dominica (6.5%, a difference of 0.20%), Immigrants from St. Vincent and the Grenadines (6.4%, a difference of 0.28%), Houma (6.4%, a difference of 0.73%), and Black/African American (6.5%, a difference of 0.74%).
| Demographics | Rating | Rank | Female Unemployment |
| Immigrants | Mexico | 0.0 /100 | #311 | Tragic 6.3% |
| Immigrants | Grenada | 0.0 /100 | #312 | Tragic 6.3% |
| Belizeans | 0.0 /100 | #313 | Tragic 6.3% |
| Immigrants | Ecuador | 0.0 /100 | #314 | Tragic 6.4% |
| Pueblo | 0.0 /100 | #315 | Tragic 6.4% |
| Houma | 0.0 /100 | #316 | Tragic 6.4% |
| Immigrants | St. Vincent and the Grenadines | 0.0 /100 | #317 | Tragic 6.4% |
| British West Indians | 0.0 /100 | #318 | Tragic 6.4% |
| Immigrants | Bangladesh | 0.0 /100 | #319 | Tragic 6.5% |
| Immigrants | Dominica | 0.0 /100 | #320 | Tragic 6.5% |
| Blacks/African Americans | 0.0 /100 | #321 | Tragic 6.5% |
| Vietnamese | 0.0 /100 | #322 | Tragic 6.5% |
| Immigrants | Belize | 0.0 /100 | #323 | Tragic 6.5% |
| Cheyenne | 0.0 /100 | #324 | Tragic 6.6% |
| Apache | 0.0 /100 | #325 | Tragic 6.6% |