Cuban vs Lumbee Unemployment Among Women with Children Under 18 years
COMPARE
Cuban
Lumbee
Unemployment Among Women with Children Under 18 years
Unemployment Among Women with Children Under 18 years Comparison
Cubans
Lumbee
5.2%
UNEMPLOYMENT AMONG WOMEN WITH CHILDREN UNDER 18 YEARS
91.8/ 100
METRIC RATING
99th/ 347
METRIC RANK
7.1%
UNEMPLOYMENT AMONG WOMEN WITH CHILDREN UNDER 18 YEARS
0.0/ 100
METRIC RATING
327th/ 347
METRIC RANK
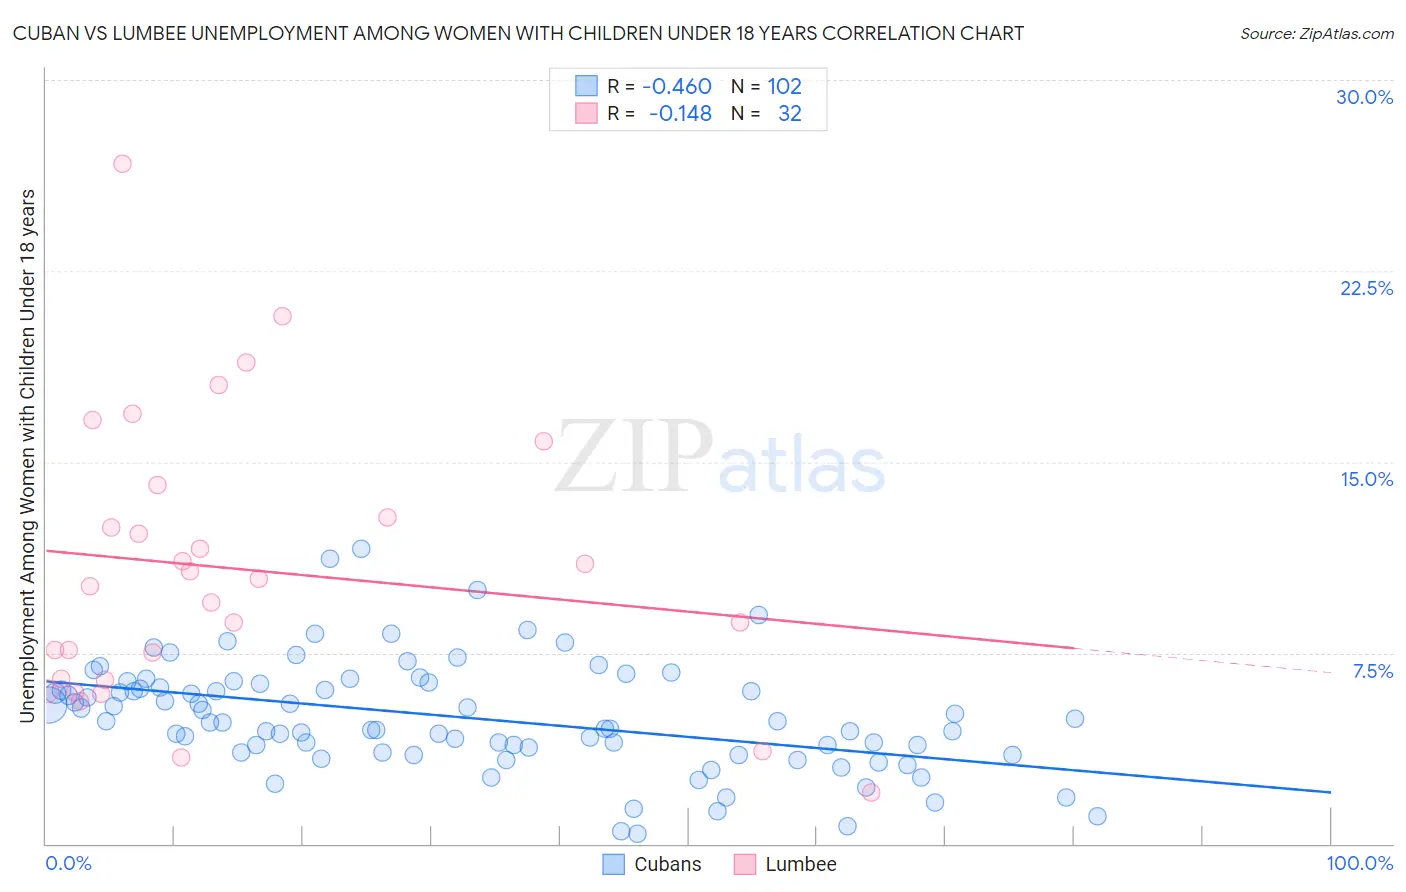
Cuban vs Lumbee Unemployment Among Women with Children Under 18 years Correlation Chart
The statistical analysis conducted on geographies consisting of 428,709,207 people shows a moderate negative correlation between the proportion of Cubans and unemployment rate among women with children under the age of 18 in the United States with a correlation coefficient (R) of -0.460 and weighted average of 5.2%. Similarly, the statistical analysis conducted on geographies consisting of 90,830,520 people shows a poor negative correlation between the proportion of Lumbee and unemployment rate among women with children under the age of 18 in the United States with a correlation coefficient (R) of -0.148 and weighted average of 7.1%, a difference of 35.9%.
Unemployment Among Women with Children Under 18 years Correlation Summary
| Measurement | Cuban | Lumbee |
| Minimum | 0.40% | 2.0% |
| Maximum | 11.6% | 26.7% |
| Range | 11.2% | 24.7% |
| Mean | 5.0% | 10.8% |
| Median | 4.8% | 10.3% |
| Interquartile 25% (IQ1) | 3.6% | 6.5% |
| Interquartile 75% (IQ3) | 6.3% | 13.4% |
| Interquartile Range (IQR) | 2.7% | 7.0% |
| Standard Deviation (Sample) | 2.1% | 5.5% |
| Standard Deviation (Population) | 2.1% | 5.4% |
Similar Demographics by Unemployment Among Women with Children Under 18 years
Demographics Similar to Cubans by Unemployment Among Women with Children Under 18 years
In terms of unemployment among women with children under 18 years, the demographic groups most similar to Cubans are Immigrants from Vietnam (5.2%, a difference of 0.060%), Immigrants from Greece (5.2%, a difference of 0.090%), Immigrants from Albania (5.2%, a difference of 0.10%), Palestinian (5.2%, a difference of 0.10%), and Immigrants from North America (5.2%, a difference of 0.12%).
| Demographics | Rating | Rank | Unemployment Among Women with Children Under 18 years |
| Immigrants | Pakistan | 93.3 /100 | #92 | Exceptional 5.2% |
| Immigrants | Canada | 93.3 /100 | #93 | Exceptional 5.2% |
| Immigrants | Kuwait | 92.6 /100 | #94 | Exceptional 5.2% |
| Immigrants | North America | 92.3 /100 | #95 | Exceptional 5.2% |
| Immigrants | Albania | 92.2 /100 | #96 | Exceptional 5.2% |
| Palestinians | 92.2 /100 | #97 | Exceptional 5.2% |
| Immigrants | Vietnam | 92.0 /100 | #98 | Exceptional 5.2% |
| Cubans | 91.8 /100 | #99 | Exceptional 5.2% |
| Immigrants | Greece | 91.4 /100 | #100 | Exceptional 5.2% |
| Immigrants | Netherlands | 91.0 /100 | #101 | Exceptional 5.2% |
| Immigrants | Cuba | 90.9 /100 | #102 | Exceptional 5.2% |
| Sri Lankans | 90.3 /100 | #103 | Exceptional 5.2% |
| Immigrants | Switzerland | 90.1 /100 | #104 | Exceptional 5.2% |
| Immigrants | France | 90.0 /100 | #105 | Excellent 5.2% |
| Pakistanis | 89.9 /100 | #106 | Excellent 5.2% |
Demographics Similar to Lumbee by Unemployment Among Women with Children Under 18 years
In terms of unemployment among women with children under 18 years, the demographic groups most similar to Lumbee are Chippewa (7.0%, a difference of 0.86%), Immigrants from Dominica (7.0%, a difference of 1.6%), Native/Alaskan (7.2%, a difference of 2.4%), Black/African American (7.3%, a difference of 2.8%), and Paiute (6.9%, a difference of 2.8%).
| Demographics | Rating | Rank | Unemployment Among Women with Children Under 18 years |
| Immigrants | Belize | 0.0 /100 | #320 | Tragic 6.7% |
| U.S. Virgin Islanders | 0.0 /100 | #321 | Tragic 6.7% |
| Houma | 0.0 /100 | #322 | Tragic 6.8% |
| Pueblo | 0.0 /100 | #323 | Tragic 6.8% |
| Paiute | 0.0 /100 | #324 | Tragic 6.9% |
| Immigrants | Dominica | 0.0 /100 | #325 | Tragic 7.0% |
| Chippewa | 0.0 /100 | #326 | Tragic 7.0% |
| Lumbee | 0.0 /100 | #327 | Tragic 7.1% |
| Natives/Alaskans | 0.0 /100 | #328 | Tragic 7.2% |
| Blacks/African Americans | 0.0 /100 | #329 | Tragic 7.3% |
| Colville | 0.0 /100 | #330 | Tragic 7.4% |
| Hopi | 0.0 /100 | #331 | Tragic 7.4% |
| Dominicans | 0.0 /100 | #332 | Tragic 7.5% |
| Immigrants | Dominican Republic | 0.0 /100 | #333 | Tragic 7.5% |
| Cheyenne | 0.0 /100 | #334 | Tragic 7.8% |