Cuban vs Lumbee In Labor Force | Age 20-64
COMPARE
Cuban
Lumbee
In Labor Force | Age 20-64
In Labor Force | Age 20-64 Comparison
Cubans
Lumbee
79.5%
IN LABOR FORCE | AGE 20-64
46.1/ 100
METRIC RATING
175th/ 347
METRIC RANK
70.6%
IN LABOR FORCE | AGE 20-64
0.0/ 100
METRIC RATING
344th/ 347
METRIC RANK
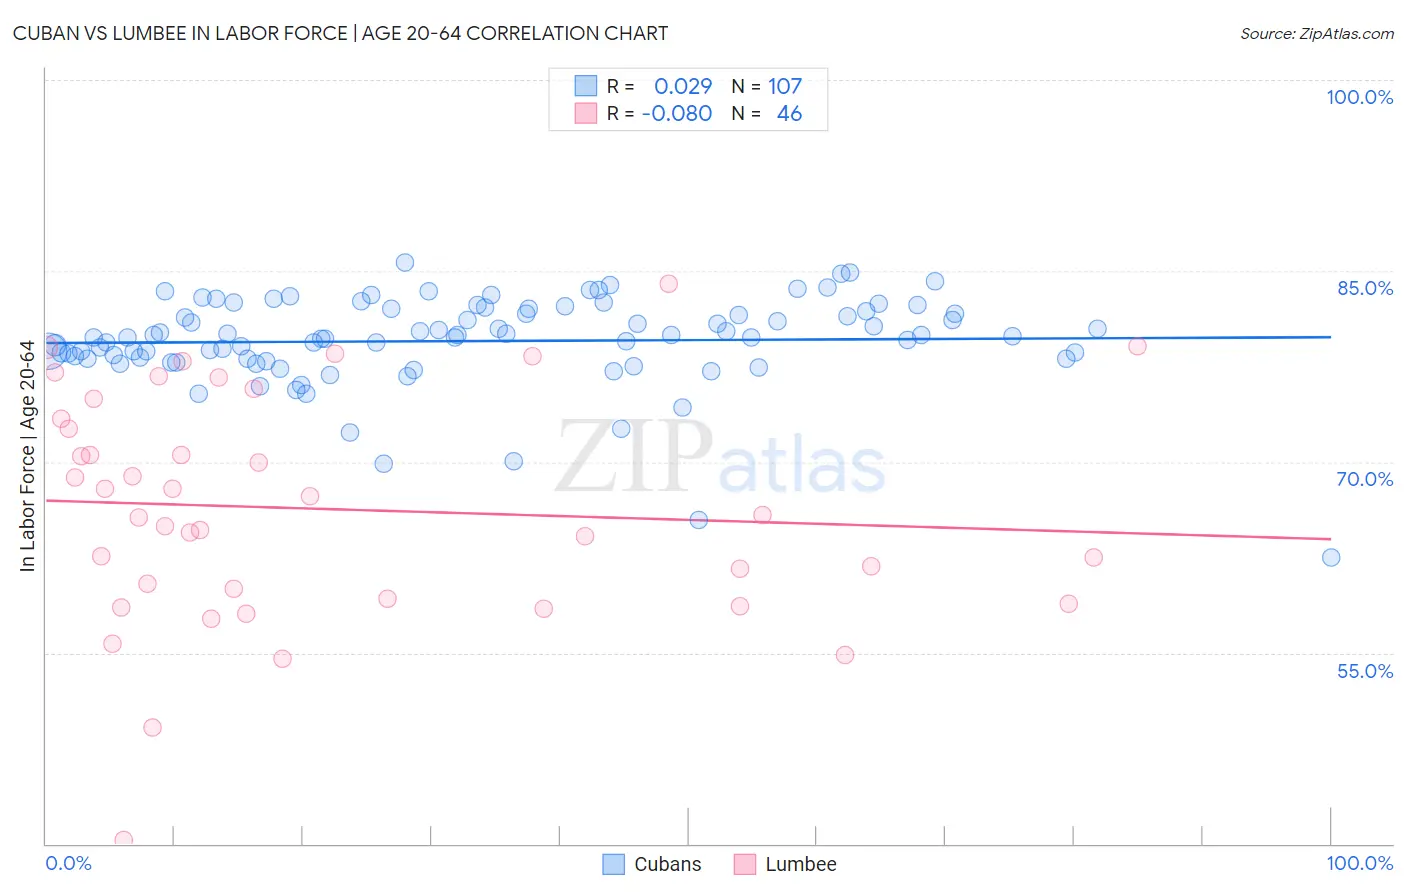
Cuban vs Lumbee In Labor Force | Age 20-64 Correlation Chart
The statistical analysis conducted on geographies consisting of 449,374,603 people shows no correlation between the proportion of Cubans and labor force participation rate among population between the ages 20 and 64 in the United States with a correlation coefficient (R) of 0.029 and weighted average of 79.5%. Similarly, the statistical analysis conducted on geographies consisting of 92,293,168 people shows a slight negative correlation between the proportion of Lumbee and labor force participation rate among population between the ages 20 and 64 in the United States with a correlation coefficient (R) of -0.080 and weighted average of 70.6%, a difference of 12.6%.
In Labor Force | Age 20-64 Correlation Summary
| Measurement | Cuban | Lumbee |
| Minimum | 62.5% | 40.3% |
| Maximum | 85.7% | 84.0% |
| Range | 23.2% | 43.7% |
| Mean | 79.5% | 66.3% |
| Median | 79.8% | 65.7% |
| Interquartile 25% (IQ1) | 78.1% | 59.2% |
| Interquartile 75% (IQ3) | 82.0% | 73.4% |
| Interquartile Range (IQR) | 3.9% | 14.2% |
| Standard Deviation (Sample) | 3.6% | 9.0% |
| Standard Deviation (Population) | 3.6% | 8.9% |
Similar Demographics by In Labor Force | Age 20-64
Demographics Similar to Cubans by In Labor Force | Age 20-64
In terms of in labor force | age 20-64, the demographic groups most similar to Cubans are Australian (79.5%, a difference of 0.0%), Immigrants from Netherlands (79.5%, a difference of 0.010%), Czechoslovakian (79.5%, a difference of 0.010%), Syrian (79.6%, a difference of 0.030%), and Armenian (79.5%, a difference of 0.040%).
| Demographics | Rating | Rank | In Labor Force | Age 20-64 |
| Immigrants | Indonesia | 61.8 /100 | #168 | Good 79.6% |
| Laotians | 58.4 /100 | #169 | Average 79.6% |
| Slavs | 54.0 /100 | #170 | Average 79.6% |
| Immigrants | Switzerland | 53.3 /100 | #171 | Average 79.6% |
| Immigrants | Belgium | 53.1 /100 | #172 | Average 79.6% |
| Immigrants | Scotland | 52.4 /100 | #173 | Average 79.6% |
| Syrians | 50.0 /100 | #174 | Average 79.6% |
| Cubans | 46.1 /100 | #175 | Average 79.5% |
| Australians | 46.0 /100 | #176 | Average 79.5% |
| Immigrants | Netherlands | 45.2 /100 | #177 | Average 79.5% |
| Czechoslovakians | 44.3 /100 | #178 | Average 79.5% |
| Armenians | 41.4 /100 | #179 | Average 79.5% |
| Salvadorans | 41.0 /100 | #180 | Average 79.5% |
| Immigrants | Saudi Arabia | 37.7 /100 | #181 | Fair 79.5% |
| Malaysians | 37.1 /100 | #182 | Fair 79.5% |
Demographics Similar to Lumbee by In Labor Force | Age 20-64
In terms of in labor force | age 20-64, the demographic groups most similar to Lumbee are Tohono O'odham (70.4%, a difference of 0.33%), Hopi (71.7%, a difference of 1.5%), Yuman (71.7%, a difference of 1.5%), Navajo (69.2%, a difference of 2.1%), and Pima (69.0%, a difference of 2.3%).
| Demographics | Rating | Rank | In Labor Force | Age 20-64 |
| Natives/Alaskans | 0.0 /100 | #333 | Tragic 73.9% |
| Apache | 0.0 /100 | #334 | Tragic 73.7% |
| Ute | 0.0 /100 | #335 | Tragic 73.7% |
| Crow | 0.0 /100 | #336 | Tragic 73.3% |
| Yup'ik | 0.0 /100 | #337 | Tragic 73.2% |
| Puerto Ricans | 0.0 /100 | #338 | Tragic 73.1% |
| Houma | 0.0 /100 | #339 | Tragic 72.7% |
| Pueblo | 0.0 /100 | #340 | Tragic 72.6% |
| Immigrants | Yemen | 0.0 /100 | #341 | Tragic 72.3% |
| Yuman | 0.0 /100 | #342 | Tragic 71.7% |
| Hopi | 0.0 /100 | #343 | Tragic 71.7% |
| Lumbee | 0.0 /100 | #344 | Tragic 70.6% |
| Tohono O'odham | 0.0 /100 | #345 | Tragic 70.4% |
| Navajo | 0.0 /100 | #346 | Tragic 69.2% |
| Pima | 0.0 /100 | #347 | Tragic 69.0% |