Crow vs Immigrants from Western Asia Female Unemployment
COMPARE
Crow
Immigrants from Western Asia
Female Unemployment
Female Unemployment Comparison
Crow
Immigrants from Western Asia
12.1%
FEMALE UNEMPLOYMENT
0.0/ 100
METRIC RATING
347th/ 347
METRIC RANK
5.6%
FEMALE UNEMPLOYMENT
1.1/ 100
METRIC RATING
247th/ 347
METRIC RANK
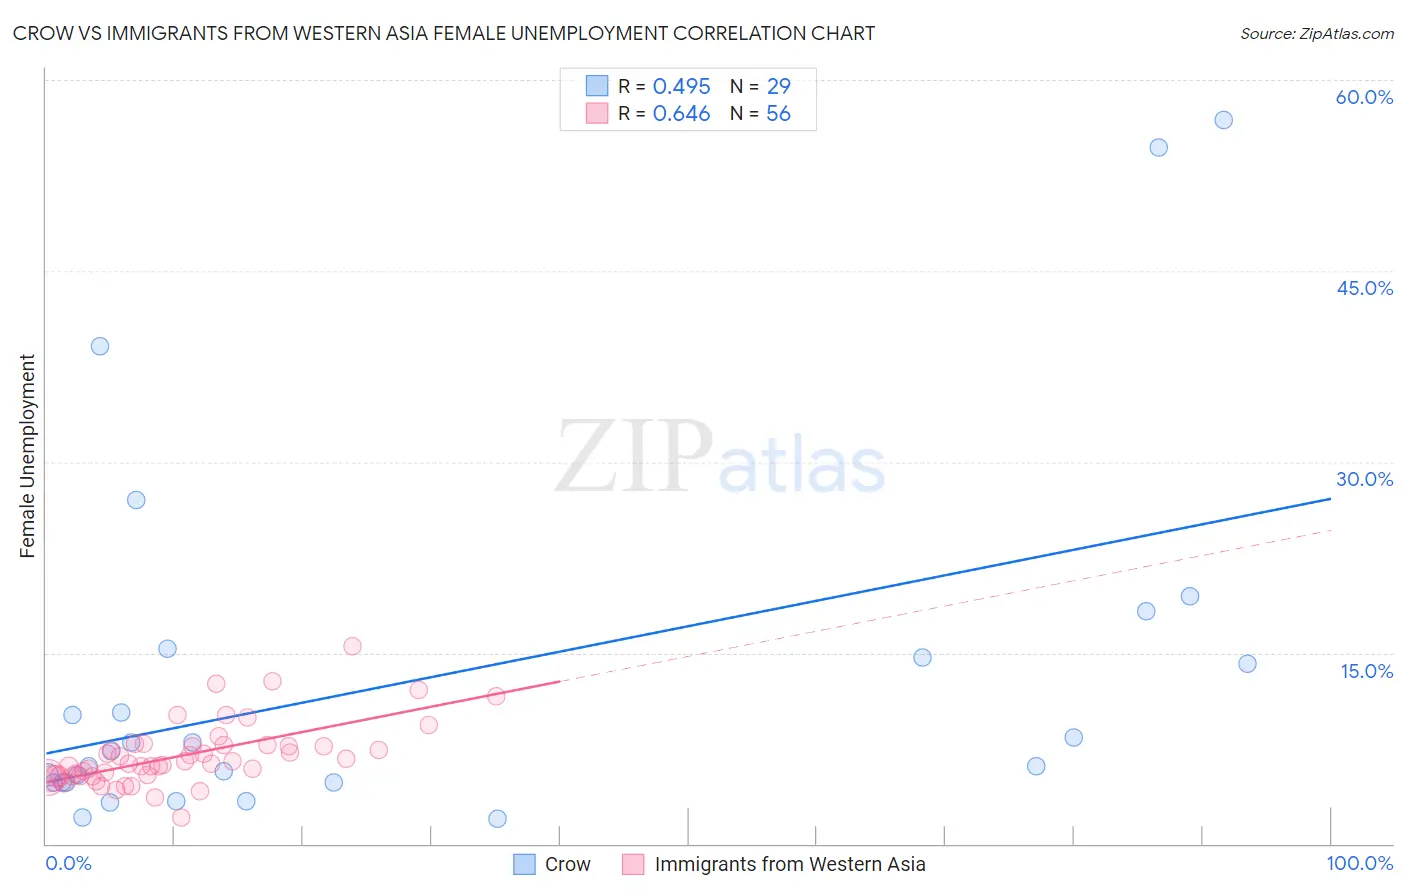
Crow vs Immigrants from Western Asia Female Unemployment Correlation Chart
The statistical analysis conducted on geographies consisting of 59,046,149 people shows a moderate positive correlation between the proportion of Crow and unemploymnet rate among females in the United States with a correlation coefficient (R) of 0.495 and weighted average of 12.1%. Similarly, the statistical analysis conducted on geographies consisting of 402,949,071 people shows a significant positive correlation between the proportion of Immigrants from Western Asia and unemploymnet rate among females in the United States with a correlation coefficient (R) of 0.646 and weighted average of 5.6%, a difference of 116.0%.
Female Unemployment Correlation Summary
| Measurement | Crow | Immigrants from Western Asia |
| Minimum | 2.0% | 2.1% |
| Maximum | 56.9% | 15.5% |
| Range | 54.9% | 13.4% |
| Mean | 12.9% | 6.9% |
| Median | 7.3% | 6.3% |
| Interquartile 25% (IQ1) | 4.8% | 5.3% |
| Interquartile 75% (IQ3) | 14.9% | 7.8% |
| Interquartile Range (IQR) | 10.1% | 2.5% |
| Standard Deviation (Sample) | 14.4% | 2.5% |
| Standard Deviation (Population) | 14.1% | 2.5% |
Similar Demographics by Female Unemployment
Demographics Similar to Crow by Female Unemployment
In terms of female unemployment, the demographic groups most similar to Crow are Yup'ik (10.9%, a difference of 11.5%), Yuman (9.6%, a difference of 26.4%), Pima (9.3%, a difference of 29.9%), Arapaho (8.8%, a difference of 37.9%), and Puerto Rican (8.3%, a difference of 45.3%).
| Demographics | Rating | Rank | Female Unemployment |
| Menominee | 0.0 /100 | #333 | Tragic 7.0% |
| Immigrants | Armenia | 0.0 /100 | #334 | Tragic 7.1% |
| Dominicans | 0.0 /100 | #335 | Tragic 7.2% |
| Immigrants | Dominican Republic | 0.0 /100 | #336 | Tragic 7.2% |
| Navajo | 0.0 /100 | #337 | Tragic 7.3% |
| Tohono O'odham | 0.0 /100 | #338 | Tragic 7.7% |
| Immigrants | Yemen | 0.0 /100 | #339 | Tragic 7.8% |
| Hopi | 0.0 /100 | #340 | Tragic 8.1% |
| Inupiat | 0.0 /100 | #341 | Tragic 8.2% |
| Puerto Ricans | 0.0 /100 | #342 | Tragic 8.3% |
| Arapaho | 0.0 /100 | #343 | Tragic 8.8% |
| Pima | 0.0 /100 | #344 | Tragic 9.3% |
| Yuman | 0.0 /100 | #345 | Tragic 9.6% |
| Yup'ik | 0.0 /100 | #346 | Tragic 10.9% |
| Crow | 0.0 /100 | #347 | Tragic 12.1% |
Demographics Similar to Immigrants from Western Asia by Female Unemployment
In terms of female unemployment, the demographic groups most similar to Immigrants from Western Asia are Japanese (5.6%, a difference of 0.080%), Cree (5.6%, a difference of 0.16%), Immigrants from Uzbekistan (5.6%, a difference of 0.20%), Guamanian/Chamorro (5.6%, a difference of 0.31%), and Immigrants from Liberia (5.6%, a difference of 0.45%).
| Demographics | Rating | Rank | Female Unemployment |
| Immigrants | South America | 2.9 /100 | #240 | Tragic 5.5% |
| South American Indians | 2.8 /100 | #241 | Tragic 5.5% |
| Marshallese | 2.3 /100 | #242 | Tragic 5.6% |
| Spanish Americans | 2.2 /100 | #243 | Tragic 5.6% |
| Immigrants | Liberia | 1.5 /100 | #244 | Tragic 5.6% |
| Guamanians/Chamorros | 1.4 /100 | #245 | Tragic 5.6% |
| Japanese | 1.2 /100 | #246 | Tragic 5.6% |
| Immigrants | Western Asia | 1.1 /100 | #247 | Tragic 5.6% |
| Cree | 1.0 /100 | #248 | Tragic 5.6% |
| Immigrants | Uzbekistan | 1.0 /100 | #249 | Tragic 5.6% |
| Immigrants | Syria | 0.8 /100 | #250 | Tragic 5.6% |
| Assyrians/Chaldeans/Syriacs | 0.8 /100 | #251 | Tragic 5.6% |
| Cajuns | 0.7 /100 | #252 | Tragic 5.7% |
| Immigrants | Sierra Leone | 0.6 /100 | #253 | Tragic 5.7% |
| Immigrants | Immigrants | 0.6 /100 | #254 | Tragic 5.7% |