Cree vs Ugandan Male Unemployment
COMPARE
Cree
Ugandan
Male Unemployment
Male Unemployment Comparison
Cree
Ugandans
5.7%
MALE UNEMPLOYMENT
0.4/ 100
METRIC RATING
249th/ 347
METRIC RANK
5.5%
MALE UNEMPLOYMENT
6.3/ 100
METRIC RATING
213th/ 347
METRIC RANK
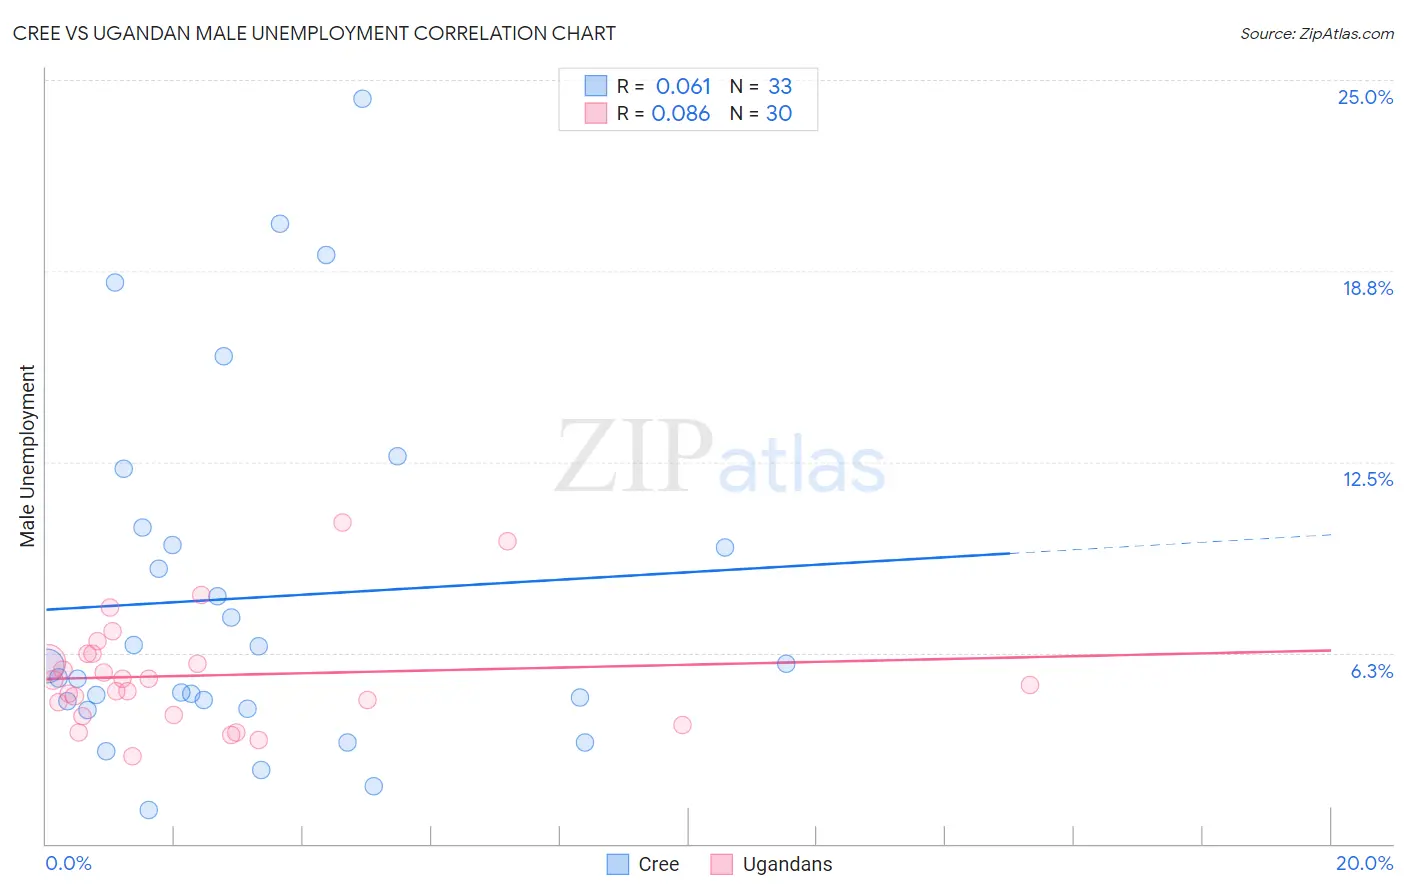
Cree vs Ugandan Male Unemployment Correlation Chart
The statistical analysis conducted on geographies consisting of 76,096,114 people shows a slight positive correlation between the proportion of Cree and unemployment rate among males in the United States with a correlation coefficient (R) of 0.061 and weighted average of 5.7%. Similarly, the statistical analysis conducted on geographies consisting of 93,962,786 people shows a slight positive correlation between the proportion of Ugandans and unemployment rate among males in the United States with a correlation coefficient (R) of 0.086 and weighted average of 5.5%, a difference of 3.8%.
Male Unemployment Correlation Summary
| Measurement | Cree | Ugandan |
| Minimum | 1.1% | 2.8% |
| Maximum | 24.4% | 10.5% |
| Range | 23.3% | 7.7% |
| Mean | 8.1% | 5.5% |
| Median | 5.8% | 5.3% |
| Interquartile 25% (IQ1) | 4.5% | 4.2% |
| Interquartile 75% (IQ3) | 10.1% | 6.2% |
| Interquartile Range (IQR) | 5.5% | 2.0% |
| Standard Deviation (Sample) | 5.8% | 1.8% |
| Standard Deviation (Population) | 5.7% | 1.8% |
Similar Demographics by Male Unemployment
Demographics Similar to Cree by Male Unemployment
In terms of male unemployment, the demographic groups most similar to Cree are Marshallese (5.7%, a difference of 0.070%), Immigrants from Bahamas (5.7%, a difference of 0.24%), Spanish American (5.7%, a difference of 0.29%), Hawaiian (5.7%, a difference of 0.39%), and Iroquois (5.7%, a difference of 0.48%).
| Demographics | Rating | Rank | Male Unemployment |
| Ottawa | 0.9 /100 | #242 | Tragic 5.7% |
| Bangladeshis | 0.8 /100 | #243 | Tragic 5.7% |
| Immigrants | El Salvador | 0.7 /100 | #244 | Tragic 5.7% |
| Yaqui | 0.7 /100 | #245 | Tragic 5.7% |
| Iroquois | 0.6 /100 | #246 | Tragic 5.7% |
| Hawaiians | 0.6 /100 | #247 | Tragic 5.7% |
| Marshallese | 0.5 /100 | #248 | Tragic 5.7% |
| Cree | 0.4 /100 | #249 | Tragic 5.7% |
| Immigrants | Bahamas | 0.4 /100 | #250 | Tragic 5.7% |
| Spanish Americans | 0.3 /100 | #251 | Tragic 5.7% |
| Mexicans | 0.2 /100 | #252 | Tragic 5.8% |
| Mexican American Indians | 0.2 /100 | #253 | Tragic 5.8% |
| Japanese | 0.2 /100 | #254 | Tragic 5.8% |
| Kiowa | 0.2 /100 | #255 | Tragic 5.8% |
| Comanche | 0.2 /100 | #256 | Tragic 5.8% |
Demographics Similar to Ugandans by Male Unemployment
In terms of male unemployment, the demographic groups most similar to Ugandans are Hmong (5.5%, a difference of 0.16%), Puget Sound Salish (5.5%, a difference of 0.17%), Israeli (5.5%, a difference of 0.25%), South American Indian (5.5%, a difference of 0.30%), and Samoan (5.5%, a difference of 0.37%).
| Demographics | Rating | Rank | Male Unemployment |
| Immigrants | Ukraine | 9.9 /100 | #206 | Tragic 5.5% |
| Immigrants | Syria | 9.3 /100 | #207 | Tragic 5.5% |
| Immigrants | Lebanon | 8.6 /100 | #208 | Tragic 5.5% |
| Immigrants | Middle Africa | 8.3 /100 | #209 | Tragic 5.5% |
| South American Indians | 7.6 /100 | #210 | Tragic 5.5% |
| Israelis | 7.4 /100 | #211 | Tragic 5.5% |
| Hmong | 7.0 /100 | #212 | Tragic 5.5% |
| Ugandans | 6.3 /100 | #213 | Tragic 5.5% |
| Puget Sound Salish | 5.6 /100 | #214 | Tragic 5.5% |
| Samoans | 4.9 /100 | #215 | Tragic 5.5% |
| Immigrants | Immigrants | 4.3 /100 | #216 | Tragic 5.5% |
| Delaware | 4.2 /100 | #217 | Tragic 5.5% |
| Immigrants | Albania | 3.6 /100 | #218 | Tragic 5.5% |
| Immigrants | Western Asia | 3.5 /100 | #219 | Tragic 5.6% |
| Portuguese | 3.5 /100 | #220 | Tragic 5.6% |