Cree vs Immigrants from Norway Male Unemployment
COMPARE
Cree
Immigrants from Norway
Male Unemployment
Male Unemployment Comparison
Cree
Immigrants from Norway
5.7%
MALE UNEMPLOYMENT
0.4/ 100
METRIC RATING
249th/ 347
METRIC RANK
5.2%
MALE UNEMPLOYMENT
71.0/ 100
METRIC RATING
160th/ 347
METRIC RANK
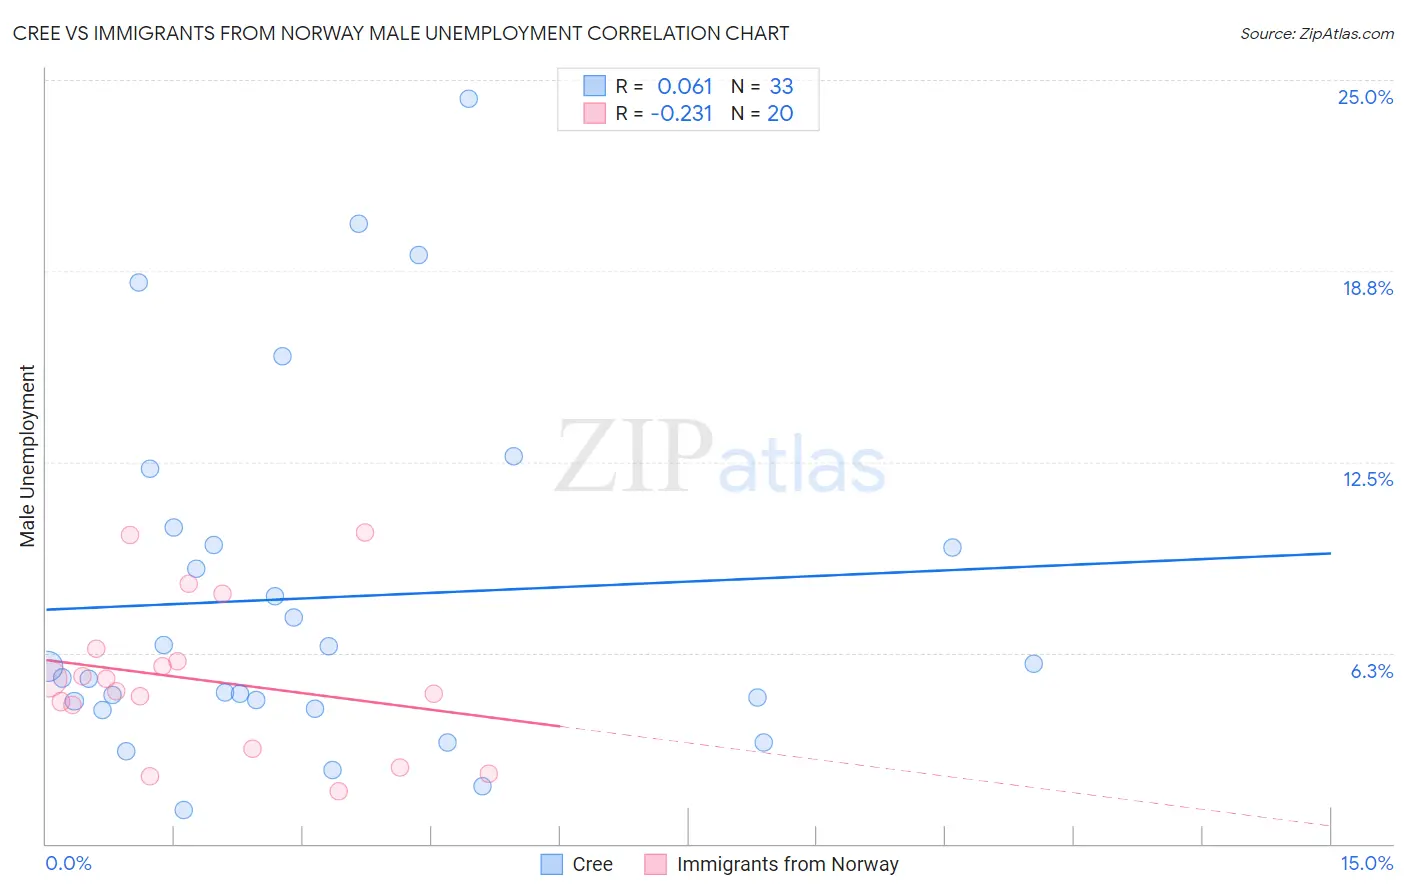
Cree vs Immigrants from Norway Male Unemployment Correlation Chart
The statistical analysis conducted on geographies consisting of 76,096,114 people shows a slight positive correlation between the proportion of Cree and unemployment rate among males in the United States with a correlation coefficient (R) of 0.061 and weighted average of 5.7%. Similarly, the statistical analysis conducted on geographies consisting of 116,545,854 people shows a weak negative correlation between the proportion of Immigrants from Norway and unemployment rate among males in the United States with a correlation coefficient (R) of -0.231 and weighted average of 5.2%, a difference of 9.4%.
Male Unemployment Correlation Summary
| Measurement | Cree | Immigrants from Norway |
| Minimum | 1.1% | 1.7% |
| Maximum | 24.4% | 10.2% |
| Range | 23.3% | 8.5% |
| Mean | 8.1% | 5.4% |
| Median | 5.8% | 5.2% |
| Interquartile 25% (IQ1) | 4.5% | 3.8% |
| Interquartile 75% (IQ3) | 10.1% | 6.2% |
| Interquartile Range (IQR) | 5.5% | 2.4% |
| Standard Deviation (Sample) | 5.8% | 2.4% |
| Standard Deviation (Population) | 5.7% | 2.4% |
Similar Demographics by Male Unemployment
Demographics Similar to Cree by Male Unemployment
In terms of male unemployment, the demographic groups most similar to Cree are Marshallese (5.7%, a difference of 0.070%), Immigrants from Bahamas (5.7%, a difference of 0.24%), Spanish American (5.7%, a difference of 0.29%), Hawaiian (5.7%, a difference of 0.39%), and Iroquois (5.7%, a difference of 0.48%).
| Demographics | Rating | Rank | Male Unemployment |
| Ottawa | 0.9 /100 | #242 | Tragic 5.7% |
| Bangladeshis | 0.8 /100 | #243 | Tragic 5.7% |
| Immigrants | El Salvador | 0.7 /100 | #244 | Tragic 5.7% |
| Yaqui | 0.7 /100 | #245 | Tragic 5.7% |
| Iroquois | 0.6 /100 | #246 | Tragic 5.7% |
| Hawaiians | 0.6 /100 | #247 | Tragic 5.7% |
| Marshallese | 0.5 /100 | #248 | Tragic 5.7% |
| Cree | 0.4 /100 | #249 | Tragic 5.7% |
| Immigrants | Bahamas | 0.4 /100 | #250 | Tragic 5.7% |
| Spanish Americans | 0.3 /100 | #251 | Tragic 5.7% |
| Mexicans | 0.2 /100 | #252 | Tragic 5.8% |
| Mexican American Indians | 0.2 /100 | #253 | Tragic 5.8% |
| Japanese | 0.2 /100 | #254 | Tragic 5.8% |
| Kiowa | 0.2 /100 | #255 | Tragic 5.8% |
| Comanche | 0.2 /100 | #256 | Tragic 5.8% |
Demographics Similar to Immigrants from Norway by Male Unemployment
In terms of male unemployment, the demographic groups most similar to Immigrants from Norway are Indonesian (5.2%, a difference of 0.010%), Immigrants from China (5.2%, a difference of 0.030%), Immigrants from Indonesia (5.2%, a difference of 0.040%), Immigrants from Northern Africa (5.2%, a difference of 0.090%), and American (5.2%, a difference of 0.12%).
| Demographics | Rating | Rank | Male Unemployment |
| Immigrants | Uruguay | 73.9 /100 | #153 | Good 5.2% |
| Laotians | 73.8 /100 | #154 | Good 5.2% |
| Immigrants | Hungary | 73.4 /100 | #155 | Good 5.2% |
| Americans | 72.7 /100 | #156 | Good 5.2% |
| Immigrants | Northern Africa | 72.3 /100 | #157 | Good 5.2% |
| Immigrants | Indonesia | 71.5 /100 | #158 | Good 5.2% |
| Indonesians | 71.2 /100 | #159 | Good 5.2% |
| Immigrants | Norway | 71.0 /100 | #160 | Good 5.2% |
| Immigrants | China | 70.6 /100 | #161 | Good 5.2% |
| Immigrants | Egypt | 65.9 /100 | #162 | Good 5.2% |
| Immigrants | Hong Kong | 65.7 /100 | #163 | Good 5.2% |
| Afghans | 62.0 /100 | #164 | Good 5.3% |
| South Americans | 60.6 /100 | #165 | Good 5.3% |
| Immigrants | Morocco | 60.2 /100 | #166 | Good 5.3% |
| Immigrants | Vietnam | 58.1 /100 | #167 | Average 5.3% |