Costa Rican vs Immigrants from Syria Unemployment
COMPARE
Costa Rican
Immigrants from Syria
Unemployment
Unemployment Comparison
Costa Ricans
Immigrants from Syria
5.3%
UNEMPLOYMENT
37.4/ 100
METRIC RATING
187th/ 347
METRIC RANK
5.5%
UNEMPLOYMENT
4.8/ 100
METRIC RATING
233rd/ 347
METRIC RANK
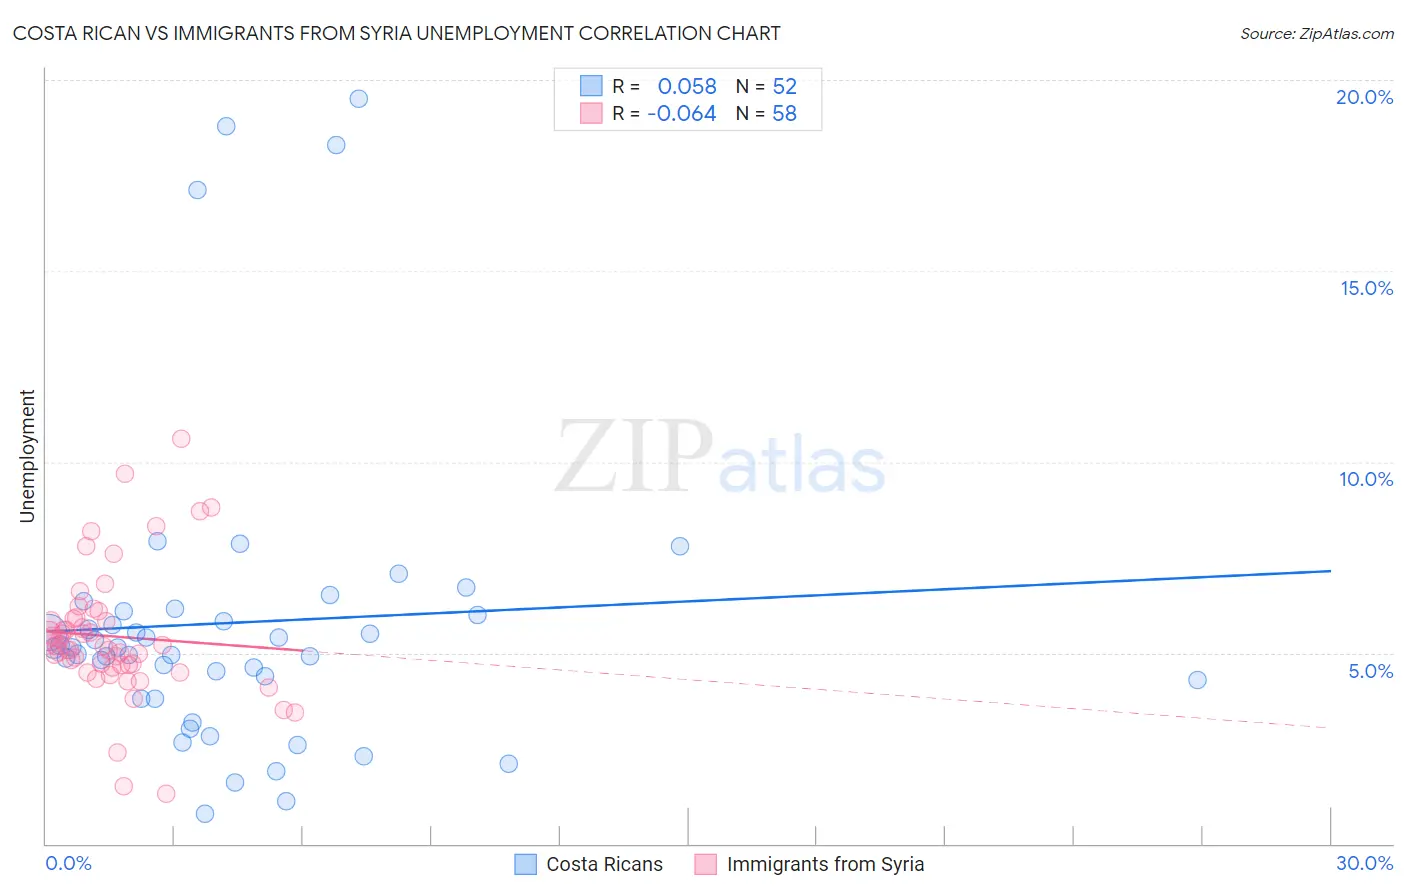
Costa Rican vs Immigrants from Syria Unemployment Correlation Chart
The statistical analysis conducted on geographies consisting of 253,503,792 people shows a slight positive correlation between the proportion of Costa Ricans and unemployment in the United States with a correlation coefficient (R) of 0.058 and weighted average of 5.3%. Similarly, the statistical analysis conducted on geographies consisting of 173,974,388 people shows a slight negative correlation between the proportion of Immigrants from Syria and unemployment in the United States with a correlation coefficient (R) of -0.064 and weighted average of 5.5%, a difference of 3.8%.
Unemployment Correlation Summary
| Measurement | Costa Rican | Immigrants from Syria |
| Minimum | 0.80% | 1.3% |
| Maximum | 19.5% | 10.6% |
| Range | 18.7% | 9.3% |
| Mean | 5.8% | 5.4% |
| Median | 5.1% | 5.2% |
| Interquartile 25% (IQ1) | 4.1% | 4.7% |
| Interquartile 75% (IQ3) | 6.0% | 5.9% |
| Interquartile Range (IQR) | 2.0% | 1.2% |
| Standard Deviation (Sample) | 4.0% | 1.7% |
| Standard Deviation (Population) | 4.0% | 1.7% |
Similar Demographics by Unemployment
Demographics Similar to Costa Ricans by Unemployment
In terms of unemployment, the demographic groups most similar to Costa Ricans are Alsatian (5.3%, a difference of 0.020%), Immigrants from Uganda (5.3%, a difference of 0.030%), Immigrants from Thailand (5.3%, a difference of 0.10%), Assyrian/Chaldean/Syriac (5.3%, a difference of 0.12%), and Immigrants from Belarus (5.3%, a difference of 0.12%).
| Demographics | Rating | Rank | Unemployment |
| Immigrants | Greece | 45.0 /100 | #180 | Average 5.3% |
| Albanians | 43.5 /100 | #181 | Average 5.3% |
| Spaniards | 42.2 /100 | #182 | Average 5.3% |
| Brazilians | 40.2 /100 | #183 | Average 5.3% |
| Assyrians/Chaldeans/Syriacs | 39.2 /100 | #184 | Fair 5.3% |
| Immigrants | Thailand | 38.9 /100 | #185 | Fair 5.3% |
| Immigrants | Uganda | 37.8 /100 | #186 | Fair 5.3% |
| Costa Ricans | 37.4 /100 | #187 | Fair 5.3% |
| Alsatians | 37.0 /100 | #188 | Fair 5.3% |
| Immigrants | Belarus | 35.6 /100 | #189 | Fair 5.3% |
| Arabs | 35.3 /100 | #190 | Fair 5.3% |
| Somalis | 34.0 /100 | #191 | Fair 5.3% |
| South Americans | 33.9 /100 | #192 | Fair 5.3% |
| Immigrants | Somalia | 33.8 /100 | #193 | Fair 5.3% |
| Immigrants | Laos | 30.9 /100 | #194 | Fair 5.3% |
Demographics Similar to Immigrants from Syria by Unemployment
In terms of unemployment, the demographic groups most similar to Immigrants from Syria are Panamanian (5.5%, a difference of 0.030%), Immigrants from Africa (5.5%, a difference of 0.050%), Comanche (5.5%, a difference of 0.050%), Hawaiian (5.5%, a difference of 0.18%), and Ottawa (5.5%, a difference of 0.18%).
| Demographics | Rating | Rank | Unemployment |
| Samoans | 7.1 /100 | #226 | Tragic 5.5% |
| Immigrants | Lebanon | 7.0 /100 | #227 | Tragic 5.5% |
| Guamanians/Chamorros | 6.3 /100 | #228 | Tragic 5.5% |
| Hawaiians | 5.4 /100 | #229 | Tragic 5.5% |
| Ottawa | 5.4 /100 | #230 | Tragic 5.5% |
| Immigrants | Africa | 4.9 /100 | #231 | Tragic 5.5% |
| Comanche | 4.9 /100 | #232 | Tragic 5.5% |
| Immigrants | Syria | 4.8 /100 | #233 | Tragic 5.5% |
| Panamanians | 4.7 /100 | #234 | Tragic 5.5% |
| Immigrants | Panama | 3.4 /100 | #235 | Tragic 5.5% |
| Immigrants | Cambodia | 3.3 /100 | #236 | Tragic 5.5% |
| Moroccans | 3.2 /100 | #237 | Tragic 5.5% |
| Immigrants | Western Asia | 2.8 /100 | #238 | Tragic 5.5% |
| Immigrants | Immigrants | 2.6 /100 | #239 | Tragic 5.5% |
| Cree | 2.6 /100 | #240 | Tragic 5.6% |