Choctaw vs Immigrants from Northern Europe Unemployment Among Seniors over 75 years
COMPARE
Choctaw
Immigrants from Northern Europe
Unemployment Among Seniors over 75 years
Unemployment Among Seniors over 75 years Comparison
Choctaw
Immigrants from Northern Europe
8.8%
UNEMPLOYMENT AMONG SENIORS OVER 75 YEARS
37.1/ 100
METRIC RATING
185th/ 347
METRIC RANK
8.9%
UNEMPLOYMENT AMONG SENIORS OVER 75 YEARS
23.9/ 100
METRIC RATING
203rd/ 347
METRIC RANK
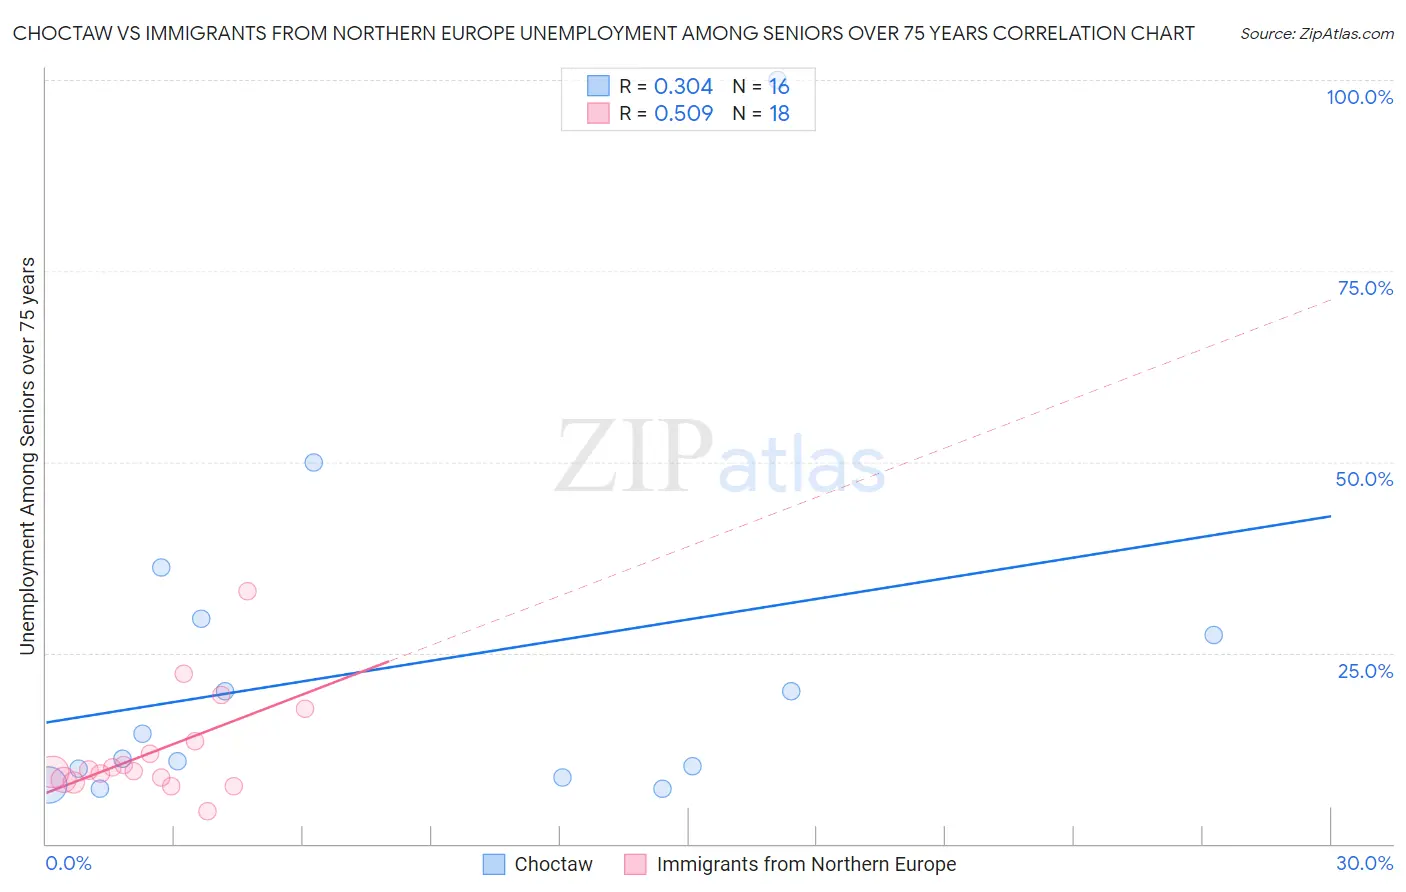
Choctaw vs Immigrants from Northern Europe Unemployment Among Seniors over 75 years Correlation Chart
The statistical analysis conducted on geographies consisting of 150,936,994 people shows a mild positive correlation between the proportion of Choctaw and unemployment rate among seniors over the age of 75 in the United States with a correlation coefficient (R) of 0.304 and weighted average of 8.8%. Similarly, the statistical analysis conducted on geographies consisting of 222,862,260 people shows a substantial positive correlation between the proportion of Immigrants from Northern Europe and unemployment rate among seniors over the age of 75 in the United States with a correlation coefficient (R) of 0.509 and weighted average of 8.9%, a difference of 0.84%.
Unemployment Among Seniors over 75 years Correlation Summary
| Measurement | Choctaw | Immigrants from Northern Europe |
| Minimum | 7.2% | 4.2% |
| Maximum | 100.0% | 33.0% |
| Range | 92.8% | 28.8% |
| Mean | 23.1% | 12.2% |
| Median | 12.8% | 9.6% |
| Interquartile 25% (IQ1) | 9.2% | 8.4% |
| Interquartile 75% (IQ3) | 28.4% | 13.5% |
| Interquartile Range (IQR) | 19.1% | 5.1% |
| Standard Deviation (Sample) | 23.9% | 6.9% |
| Standard Deviation (Population) | 23.1% | 6.7% |
Demographics Similar to Choctaw and Immigrants from Northern Europe by Unemployment Among Seniors over 75 years
In terms of unemployment among seniors over 75 years, the demographic groups most similar to Choctaw are Immigrants from Micronesia (8.8%, a difference of 0.0%), Immigrants from Ethiopia (8.8%, a difference of 0.050%), Immigrants from Europe (8.8%, a difference of 0.11%), Immigrants from Eastern Europe (8.8%, a difference of 0.14%), and Immigrants from Haiti (8.8%, a difference of 0.14%). Similarly, the demographic groups most similar to Immigrants from Northern Europe are Russian (8.9%, a difference of 0.020%), Immigrants from Peru (8.9%, a difference of 0.030%), Pakistani (8.9%, a difference of 0.11%), Osage (8.9%, a difference of 0.11%), and Eastern European (8.9%, a difference of 0.14%).
| Demographics | Rating | Rank | Unemployment Among Seniors over 75 years |
| Immigrants | Micronesia | 37.2 /100 | #184 | Fair 8.8% |
| Choctaw | 37.1 /100 | #185 | Fair 8.8% |
| Immigrants | Ethiopia | 36.2 /100 | #186 | Fair 8.8% |
| Immigrants | Europe | 35.2 /100 | #187 | Fair 8.8% |
| Immigrants | Eastern Europe | 34.7 /100 | #188 | Fair 8.8% |
| Immigrants | Haiti | 34.7 /100 | #189 | Fair 8.8% |
| Mexican American Indians | 34.7 /100 | #190 | Fair 8.8% |
| Estonians | 33.3 /100 | #191 | Fair 8.8% |
| Immigrants | Kenya | 31.8 /100 | #192 | Fair 8.8% |
| Immigrants | Guyana | 29.9 /100 | #193 | Fair 8.8% |
| Maltese | 29.2 /100 | #194 | Fair 8.8% |
| Okinawans | 28.9 /100 | #195 | Fair 8.8% |
| Immigrants | Jamaica | 27.7 /100 | #196 | Fair 8.9% |
| Immigrants | Laos | 26.3 /100 | #197 | Fair 8.9% |
| Eastern Europeans | 25.9 /100 | #198 | Fair 8.9% |
| Pakistanis | 25.4 /100 | #199 | Fair 8.9% |
| Osage | 25.4 /100 | #200 | Fair 8.9% |
| Immigrants | Peru | 24.3 /100 | #201 | Fair 8.9% |
| Russians | 24.1 /100 | #202 | Fair 8.9% |
| Immigrants | Northern Europe | 23.9 /100 | #203 | Fair 8.9% |
| Spaniards | 22.0 /100 | #204 | Fair 8.9% |