Choctaw vs Immigrants from Northern Europe In Labor Force | Age 45-54

COMPARE

Choctaw
Race
Ancestry
AfghanAfricanAlaska NativeAlaskan AthabascanAlbanianAleutAlsatianAmericanApacheArabArapahoArgentineanArmenianAssyrian/Chaldean/SyriacAustralianAustrianBahamianBangladeshiBarbadianBasqueBelgianBelizeanBermudanBhutaneseBlackfeetBolivianBrazilianBritishBritish West IndianBulgarianBurmeseCajunCambodianCanadianCape VerdeanCarpatho RusynCelticCentral AmericanCentral American IndianCherokeeCheyenneChickasawChileanChineseChippewaChoctawColombianColvilleComancheCosta RicanCreeCreekCroatianCrowCubanCypriotCzechCzechoslovakianDanishDelawareDominicanDutchDutch West IndianEastern EuropeanEcuadorianEgyptianEnglishEstonianEthiopianEuropeanFijianFilipinoFinnishFrenchFrench American IndianFrench CanadianGermanGerman RussianGhanaianGreekGuamanian/ChamorroGuatemalanGuyaneseHaitianHmongHonduranHopiHoumaHungarianIcelanderIndian (Asian)IndonesianInupiatIranianIraqiIrishIroquoisIsraeliItalianJamaicanJapaneseJordanianKenyanKiowaKoreanLaotianLatvianLebaneseLiberianLithuanianLumbeeLuxembourgerMacedonianMalaysianMalteseMarshalleseMenomineeMexicanMexican American IndianMongolianMoroccanNative HawaiianNavajoNepaleseNew ZealanderNicaraguanNigerianNorthern EuropeanNorwegianOkinawanOsageOttawaPaiutePakistaniPalestinianPanamanianParaguayanPennsylvania GermanPeruvianPimaPolishPortuguesePotawatomiPuebloPuerto RicanPuget Sound SalishRomanianRussianSalvadoranSamoanScandinavianScotch-IrishScottishSeminoleSenegaleseSerbianShoshoneSierra LeoneanSiouxSlavicSlovakSloveneSomaliSouth AfricanSouth AmericanSouth American IndianSoviet UnionSpaniardSpanishSpanish AmericanSpanish American IndianSri LankanSubsaharan AfricanSudaneseSwedishSwissSyrianTaiwaneseThaiTlingit-HaidaTohono O'OdhamTonganTrinidadian and TobagonianTsimshianTurkishU.S. Virgin IslanderUgandanUkrainianUruguayanUteVenezuelanVietnameseWelshWest IndianYakamaYaquiYugoslavianYumanYup'ikZimbabwean
Immigration
NonimmigrantsImmigrantsAfghanistanAfricaAlbaniaArgentinaArmeniaAsiaAustraliaAustriaBahamasBangladeshBarbadosBelarusBelgiumBelizeBoliviaBosnia and HerzegovinaBrazilBulgariaBurma/MyanmarCabo VerdeCambodiaCameroonCanadaCaribbeanCentral AmericaChileChinaColombiaCongoCosta RicaCroatiaCubaCzechoslovakiaDenmarkDominicaDominican RepublicEastern AfricaEastern AsiaEastern EuropeEcuadorEgyptEl SalvadorEnglandEritreaEthiopiaEuropeFijiFranceGermanyGhanaGreeceGrenadaGuatemalaGuyanaHaitiHondurasHong KongHungaryIndiaIndonesiaIranIraqIrelandIsraelItalyJamaicaJapanJordanKazakhstanKenyaKoreaKuwaitLaosLatin AmericaLatviaLebanonLiberiaLithuaniaMalaysiaMexicoMicronesiaMiddle AfricaMoldovaMoroccoNepalNetherlandsNicaraguaNigeriaNorth AmericaNorth MacedoniaNorthern AfricaNorwayOceaniaPakistanPanamaPeruPhilippinesPolandPortugalRomaniaRussiaSaudi ArabiaScotlandSenegalSerbiaSierra LeoneSingaporeSomaliaSouth AfricaSouth AmericaSouth Central AsiaSouth Eastern AsiaSouthern EuropeSpainSri LankaSt. Vincent and the GrenadinesSudanSwedenSwitzerlandSyriaTaiwanThailandTrinidad and TobagoTurkeyUgandaUkraineUruguayUzbekistanVenezuelaVietnamWest IndiesWestern AfricaWestern AsiaWestern EuropeYemenZaireZimbabweAzores
Immigrants from Northern Europe
Race
Ancestry
AfghanAfricanAlaska NativeAlaskan AthabascanAlbanianAleutAlsatianAmericanApacheArabArapahoArgentineanArmenianAssyrian/Chaldean/SyriacAustralianAustrianBahamianBangladeshiBarbadianBasqueBelgianBelizeanBermudanBhutaneseBlackfeetBolivianBrazilianBritishBritish West IndianBulgarianBurmeseCajunCambodianCanadianCape VerdeanCarpatho RusynCelticCentral AmericanCentral American IndianCherokeeCheyenneChickasawChileanChineseChippewaColombianColvilleComancheCosta RicanCreeCreekCroatianCrowCubanCypriotCzechCzechoslovakianDanishDelawareDominicanDutchDutch West IndianEastern EuropeanEcuadorianEgyptianEnglishEstonianEthiopianEuropeanFijianFilipinoFinnishFrenchFrench American IndianFrench CanadianGermanGerman RussianGhanaianGreekGuamanian/ChamorroGuatemalanGuyaneseHaitianHmongHonduranHopiHoumaHungarianIcelanderIndian (Asian)IndonesianInupiatIranianIraqiIrishIroquoisIsraeliItalianJamaicanJapaneseJordanianKenyanKiowaKoreanLaotianLatvianLebaneseLiberianLithuanianLumbeeLuxembourgerMacedonianMalaysianMalteseMarshalleseMenomineeMexicanMexican American IndianMongolianMoroccanNative HawaiianNavajoNepaleseNew ZealanderNicaraguanNigerianNorthern EuropeanNorwegianOkinawanOsageOttawaPaiutePakistaniPalestinianPanamanianParaguayanPennsylvania GermanPeruvianPimaPolishPortuguesePotawatomiPuebloPuerto RicanPuget Sound SalishRomanianRussianSalvadoranSamoanScandinavianScotch-IrishScottishSeminoleSenegaleseSerbianShoshoneSierra LeoneanSiouxSlavicSlovakSloveneSomaliSouth AfricanSouth AmericanSouth American IndianSoviet UnionSpaniardSpanishSpanish AmericanSpanish American IndianSri LankanSubsaharan AfricanSudaneseSwedishSwissSyrianTaiwaneseThaiTlingit-HaidaTohono O'OdhamTonganTrinidadian and TobagonianTsimshianTurkishU.S. Virgin IslanderUgandanUkrainianUruguayanUteVenezuelanVietnameseWelshWest IndianYakamaYaquiYugoslavianYumanYup'ikZimbabwean
Immigration
NonimmigrantsImmigrantsAfghanistanAfricaAlbaniaArgentinaArmeniaAsiaAustraliaAustriaBahamasBangladeshBarbadosBelarusBelgiumBelizeBoliviaBosnia and HerzegovinaBrazilBulgariaBurma/MyanmarCabo VerdeCambodiaCameroonCanadaCaribbeanCentral AmericaChileChinaColombiaCongoCosta RicaCroatiaCubaCzechoslovakiaDenmarkDominicaDominican RepublicEastern AfricaEastern AsiaEastern EuropeEcuadorEgyptEl SalvadorEnglandEritreaEthiopiaEuropeFijiFranceGermanyGhanaGreeceGrenadaGuatemalaGuyanaHaitiHondurasHong KongHungaryIndiaIndonesiaIranIraqIrelandIsraelItalyJamaicaJapanJordanKazakhstanKenyaKoreaKuwaitLaosLatin AmericaLatviaLebanonLiberiaLithuaniaMalaysiaMexicoMicronesiaMiddle AfricaMoldovaMoroccoNepalNetherlandsNicaraguaNigeriaNorth AmericaNorth MacedoniaNorthern AfricaNorthern EuropeNorwayOceaniaPakistanPanamaPeruPhilippinesPolandPortugalRomaniaRussiaSaudi ArabiaScotlandSenegalSerbiaSierra LeoneSingaporeSomaliaSouth AfricaSouth AmericaSouth Central AsiaSouth Eastern AsiaSouthern EuropeSpainSri LankaSt. Vincent and the GrenadinesSudanSwedenSwitzerlandSyriaTaiwanThailandTrinidad and TobagoTurkeyUgandaUkraineUruguayUzbekistanVenezuelaVietnamWest IndiesWestern AfricaWestern AsiaWestern EuropeYemenZaireZimbabweAzores
In Labor Force | Age 45-54
Income
Poverty
Unemployment
Labor Participation
Family Structure
Vehicle Availability
Education Level
Disability

In Labor Force | Age 45-54 Comparison

Choctaw

Immigrants from Northern Europe

Tragic
Excellent
78.2%
IN LABOR FORCE | AGE 45-54
0.0/ 100
METRIC RATING
325th/ 347
METRIC RANK
83.1%
IN LABOR FORCE | AGE 45-54
85.1/ 100
METRIC RATING
129th/ 347
METRIC RANK

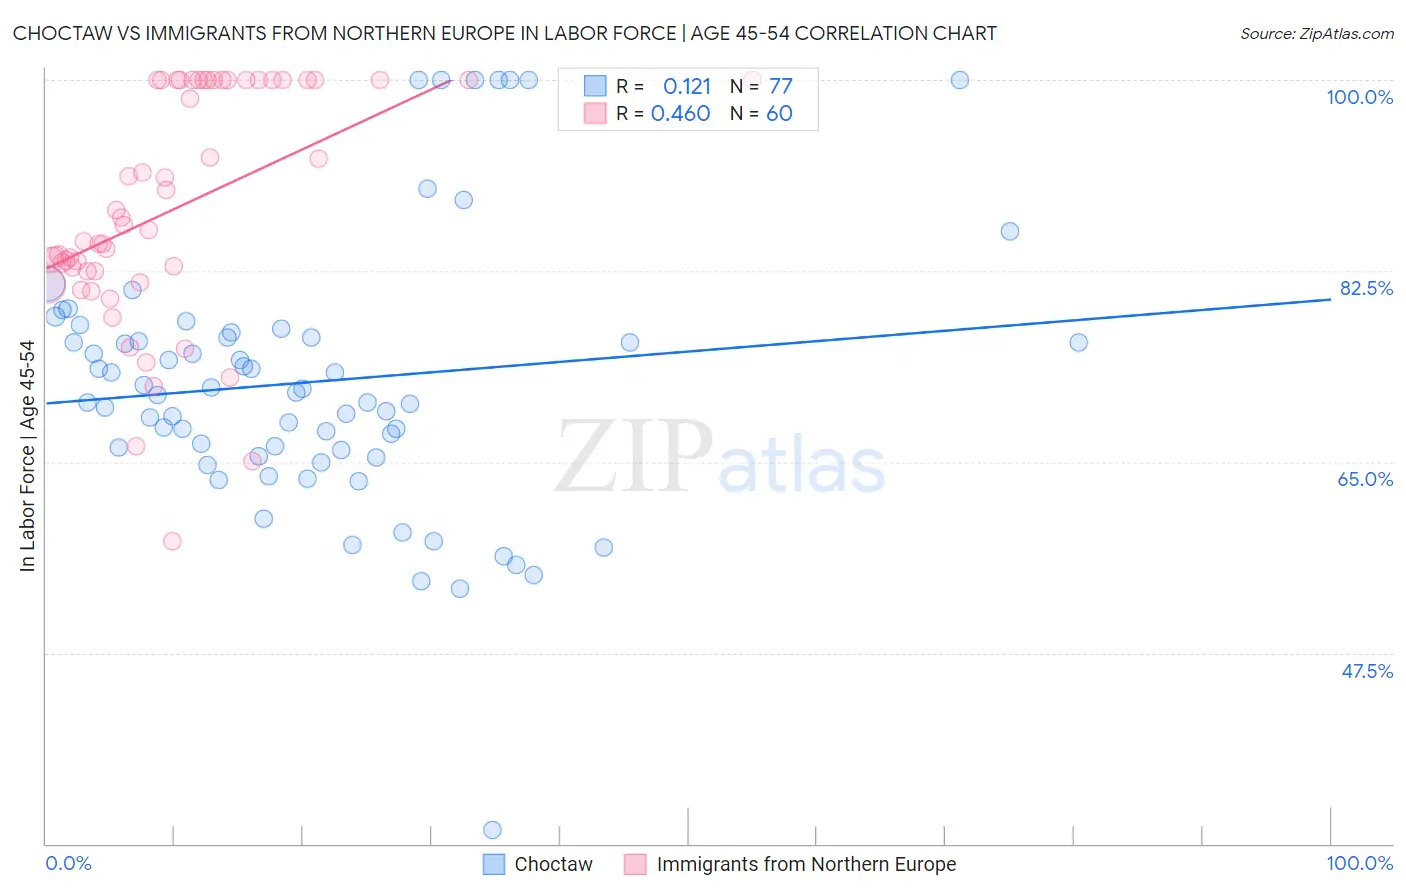
Choctaw vs Immigrants from Northern Europe In Labor Force | Age 45-54 Correlation Chart

The statistical analysis conducted on geographies consisting of 269,621,140 people shows a poor positive correlation between the proportion of Choctaw and labor force participation rate among population between the ages 45 and 54 in the United States with a correlation coefficient (R) of 0.121 and weighted average of 78.2%. Similarly, the statistical analysis conducted on geographies consisting of 476,905,263 people shows a moderate positive correlation between the proportion of Immigrants from Northern Europe and labor force participation rate among population between the ages 45 and 54 in the United States with a correlation coefficient (R) of 0.460 and weighted average of 83.1%, a difference of 6.3%.
Choctaw vs Immigrants from Northern Europe In Labor Force | Age 45-54

In Labor Force | Age 45-54 Correlation Summary

MeasurementChoctawImmigrants from Northern Europe
Minimum31.3%57.7%
Maximum100.0%100.0%
Range68.7%42.3%
Mean72.4%88.2%
Median71.3%86.5%
Interquartile 25% (IQ1)65.8%82.5%
Interquartile 75% (IQ3)76.6%100.0%
Interquartile Range (IQR)10.8%17.5%
Standard Deviation (Sample)12.4%10.6%
Standard Deviation (Population)12.3%10.5%

Similar Demographics by In Labor Force | Age 45-54

Demographics Similar to Choctaw by In Labor Force | Age 45-54

In terms of in labor force | age 45-54, the demographic groups most similar to Choctaw are Seminole (78.1%, a difference of 0.050%), Cajun (78.1%, a difference of 0.050%), Dutch West Indian (78.2%, a difference of 0.090%), Kiowa (78.3%, a difference of 0.11%), and Crow (78.3%, a difference of 0.20%).
DemographicsRating | RankIn Labor Force | Age 45-54
Chickasaw
0.0
/100
|
#318
Tragic
79.0%
Cherokee
0.0
/100
|
#319
Tragic
79.0%
Yaqui
0.0
/100
|
#320
Tragic
78.9%
Yup'ik
0.0
/100
|
#321
Tragic
78.6%
Crow
0.0
/100
|
#322
Tragic
78.3%
Kiowa
0.0
/100
|
#323
Tragic
78.3%
Dutch West Indians
0.0
/100
|
#324
Tragic
78.2%
Choctaw
0.0
/100
|
#325
Tragic
78.2%
Seminole
0.0
/100
|
#326
Tragic
78.1%
Cajuns
0.0
/100
|
#327
Tragic
78.1%
Sioux
0.0
/100
|
#328
Tragic
78.0%
Creek
0.0
/100
|
#329
Tragic
77.7%
Cheyenne
0.0
/100
|
#330
Tragic
77.6%
Tsimshian
0.0
/100
|
#331
Tragic
77.4%
Menominee
0.0
/100
|
#332
Tragic
77.4%

Demographics Similar to Immigrants from Northern Europe by In Labor Force | Age 45-54

In terms of in labor force | age 45-54, the demographic groups most similar to Immigrants from Northern Europe are Immigrants from Jordan (83.1%, a difference of 0.0%), German (83.1%, a difference of 0.0%), Immigrants from Israel (83.1%, a difference of 0.010%), Immigrants from Belgium (83.1%, a difference of 0.020%), and Finnish (83.1%, a difference of 0.030%).
DemographicsRating | RankIn Labor Force | Age 45-54
Immigrants | Vietnam
88.9
/100
|
#122
Excellent
83.1%
Tongans
88.2
/100
|
#123
Excellent
83.1%
Bermudans
88.0
/100
|
#124
Excellent
83.1%
Immigrants | Iran
87.2
/100
|
#125
Excellent
83.1%
Immigrants | Belgium
86.4
/100
|
#126
Excellent
83.1%
Immigrants | Jordan
85.2
/100
|
#127
Excellent
83.1%
Germans
85.1
/100
|
#128
Excellent
83.1%
Immigrants | Northern Europe
85.1
/100
|
#129
Excellent
83.1%
Immigrants | Israel
84.7
/100
|
#130
Excellent
83.1%
Finns
83.3
/100
|
#131
Excellent
83.1%
Immigrants | Ukraine
82.9
/100
|
#132
Excellent
83.0%
Liberians
82.7
/100
|
#133
Excellent
83.0%
Sudanese
82.0
/100
|
#134
Excellent
83.0%
Austrians
81.3
/100
|
#135
Excellent
83.0%
Immigrants | Kazakhstan
81.0
/100
|
#136
Excellent
83.0%