Chinese vs Crow Unemployment Among Ages 25 to 29 years
COMPARE
Chinese
Crow
Unemployment Among Ages 25 to 29 years
Unemployment Among Ages 25 to 29 years Comparison
Chinese
Crow
6.1%
UNEMPLOYMENT AMONG AGES 25 TO 29 YEARS
99.6/ 100
METRIC RATING
32nd/ 347
METRIC RANK
15.4%
UNEMPLOYMENT AMONG AGES 25 TO 29 YEARS
0.0/ 100
METRIC RATING
346th/ 347
METRIC RANK
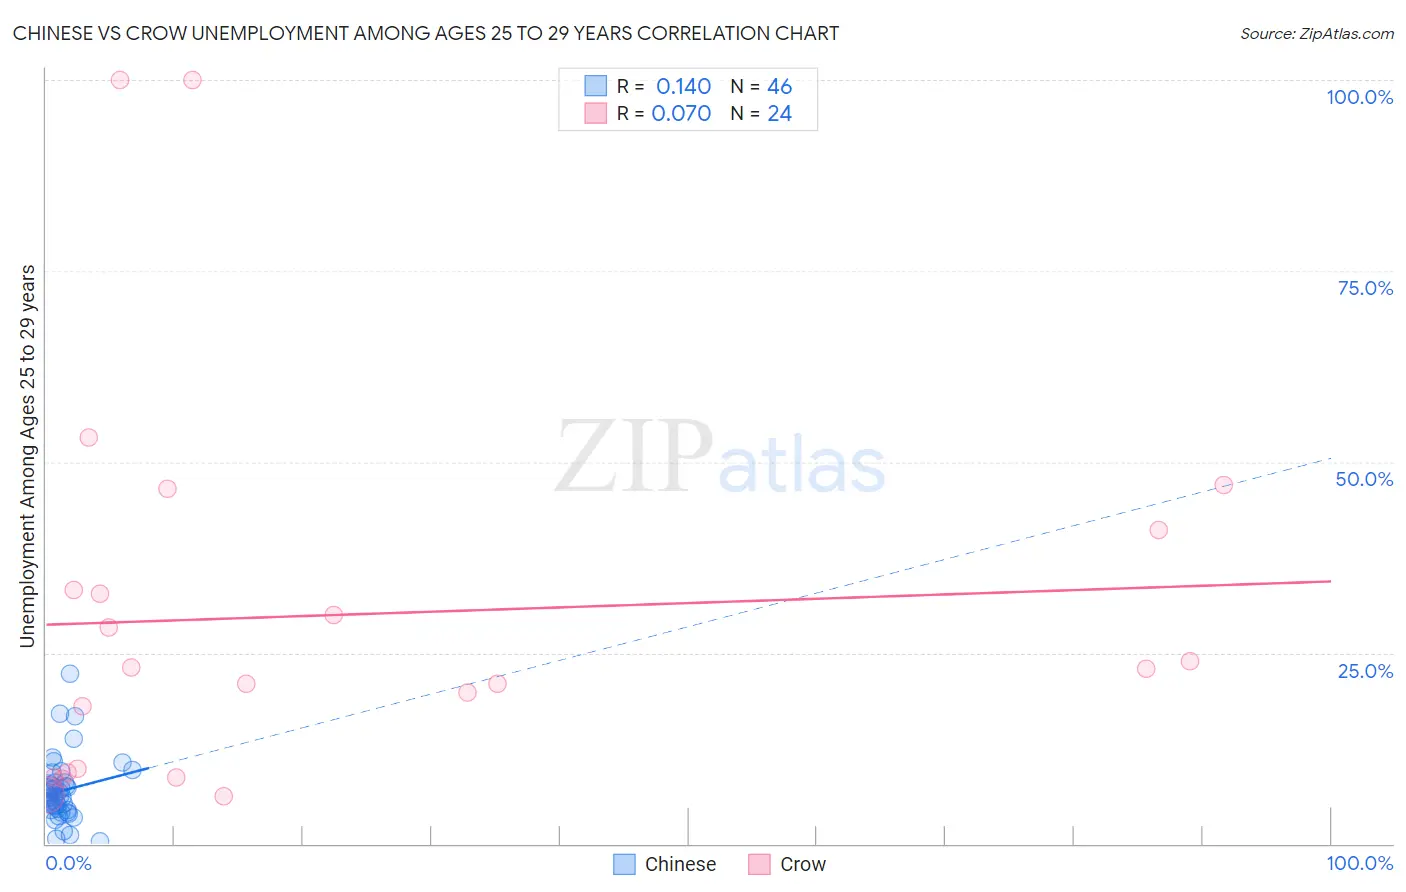
Chinese vs Crow Unemployment Among Ages 25 to 29 years Correlation Chart
The statistical analysis conducted on geographies consisting of 63,787,303 people shows a poor positive correlation between the proportion of Chinese and unemployment rate among population between the ages 25 and 29 in the United States with a correlation coefficient (R) of 0.140 and weighted average of 6.1%. Similarly, the statistical analysis conducted on geographies consisting of 58,166,191 people shows a slight positive correlation between the proportion of Crow and unemployment rate among population between the ages 25 and 29 in the United States with a correlation coefficient (R) of 0.070 and weighted average of 15.4%, a difference of 152.6%.
Unemployment Among Ages 25 to 29 years Correlation Summary
| Measurement | Chinese | Crow |
| Minimum | 0.40% | 6.3% |
| Maximum | 22.2% | 100.0% |
| Range | 21.8% | 93.7% |
| Mean | 7.0% | 30.0% |
| Median | 6.3% | 23.0% |
| Interquartile 25% (IQ1) | 4.5% | 9.5% |
| Interquartile 75% (IQ3) | 8.0% | 37.2% |
| Interquartile Range (IQR) | 3.5% | 27.7% |
| Standard Deviation (Sample) | 4.2% | 25.5% |
| Standard Deviation (Population) | 4.2% | 24.9% |
Similar Demographics by Unemployment Among Ages 25 to 29 years
Demographics Similar to Chinese by Unemployment Among Ages 25 to 29 years
In terms of unemployment among ages 25 to 29 years, the demographic groups most similar to Chinese are Yugoslavian (6.1%, a difference of 0.10%), Filipino (6.1%, a difference of 0.35%), Immigrants from Morocco (6.1%, a difference of 0.36%), Immigrants from Zimbabwe (6.1%, a difference of 0.40%), and Taiwanese (6.1%, a difference of 0.42%).
| Demographics | Rating | Rank | Unemployment Among Ages 25 to 29 years |
| New Zealanders | 99.8 /100 | #25 | Exceptional 6.0% |
| Immigrants | Eastern Africa | 99.8 /100 | #26 | Exceptional 6.0% |
| Immigrants | Zaire | 99.7 /100 | #27 | Exceptional 6.0% |
| Danes | 99.7 /100 | #28 | Exceptional 6.0% |
| Immigrants | South Central Asia | 99.7 /100 | #29 | Exceptional 6.1% |
| Bulgarians | 99.7 /100 | #30 | Exceptional 6.1% |
| Filipinos | 99.7 /100 | #31 | Exceptional 6.1% |
| Chinese | 99.6 /100 | #32 | Exceptional 6.1% |
| Yugoslavians | 99.6 /100 | #33 | Exceptional 6.1% |
| Immigrants | Morocco | 99.5 /100 | #34 | Exceptional 6.1% |
| Immigrants | Zimbabwe | 99.5 /100 | #35 | Exceptional 6.1% |
| Taiwanese | 99.5 /100 | #36 | Exceptional 6.1% |
| Immigrants | Serbia | 99.5 /100 | #37 | Exceptional 6.1% |
| Ethiopians | 99.4 /100 | #38 | Exceptional 6.1% |
| Indonesians | 99.3 /100 | #39 | Exceptional 6.1% |
Demographics Similar to Crow by Unemployment Among Ages 25 to 29 years
In terms of unemployment among ages 25 to 29 years, the demographic groups most similar to Crow are Arapaho (15.4%, a difference of 0.070%), Hopi (13.5%, a difference of 13.8%), Inupiat (13.4%, a difference of 14.5%), Yup'ik (17.9%, a difference of 16.6%), and Navajo (12.2%, a difference of 26.3%).
| Demographics | Rating | Rank | Unemployment Among Ages 25 to 29 years |
| Alaskan Athabascans | 0.0 /100 | #333 | Tragic 10.8% |
| Yuman | 0.0 /100 | #334 | Tragic 11.0% |
| Puerto Ricans | 0.0 /100 | #335 | Tragic 11.1% |
| Lumbee | 0.0 /100 | #336 | Tragic 11.2% |
| Menominee | 0.0 /100 | #337 | Tragic 11.3% |
| Sioux | 0.0 /100 | #338 | Tragic 11.7% |
| Pima | 0.0 /100 | #339 | Tragic 11.8% |
| Cheyenne | 0.0 /100 | #340 | Tragic 11.8% |
| Tohono O'odham | 0.0 /100 | #341 | Tragic 12.1% |
| Navajo | 0.0 /100 | #342 | Tragic 12.2% |
| Inupiat | 0.0 /100 | #343 | Tragic 13.4% |
| Hopi | 0.0 /100 | #344 | Tragic 13.5% |
| Arapaho | 0.0 /100 | #345 | Tragic 15.4% |
| Crow | 0.0 /100 | #346 | Tragic 15.4% |
| Yup'ik | 0.0 /100 | #347 | Tragic 17.9% |