African vs Crow Unemployment Among Ages 25 to 29 years
COMPARE
African
Crow
Unemployment Among Ages 25 to 29 years
Unemployment Among Ages 25 to 29 years Comparison
Africans
Crow
7.6%
UNEMPLOYMENT AMONG AGES 25 TO 29 YEARS
0.0/ 100
METRIC RATING
288th/ 347
METRIC RANK
15.4%
UNEMPLOYMENT AMONG AGES 25 TO 29 YEARS
0.0/ 100
METRIC RATING
346th/ 347
METRIC RANK
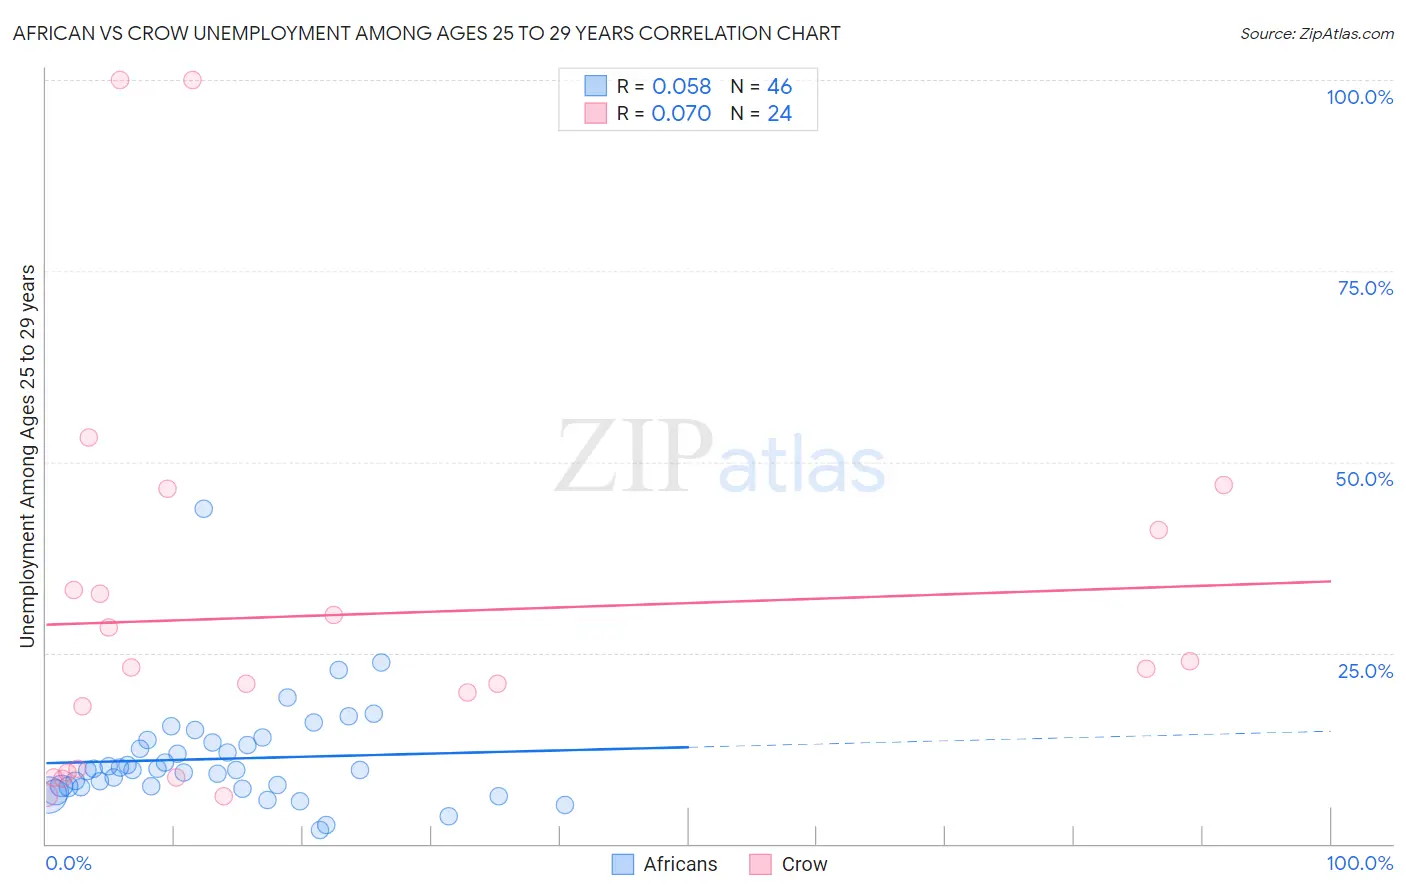
African vs Crow Unemployment Among Ages 25 to 29 years Correlation Chart
The statistical analysis conducted on geographies consisting of 443,131,541 people shows a slight positive correlation between the proportion of Africans and unemployment rate among population between the ages 25 and 29 in the United States with a correlation coefficient (R) of 0.058 and weighted average of 7.6%. Similarly, the statistical analysis conducted on geographies consisting of 58,166,191 people shows a slight positive correlation between the proportion of Crow and unemployment rate among population between the ages 25 and 29 in the United States with a correlation coefficient (R) of 0.070 and weighted average of 15.4%, a difference of 101.2%.
Unemployment Among Ages 25 to 29 years Correlation Summary
| Measurement | African | Crow |
| Minimum | 1.8% | 6.3% |
| Maximum | 43.9% | 100.0% |
| Range | 42.1% | 93.7% |
| Mean | 11.1% | 30.0% |
| Median | 9.7% | 23.0% |
| Interquartile 25% (IQ1) | 7.5% | 9.5% |
| Interquartile 75% (IQ3) | 13.3% | 37.2% |
| Interquartile Range (IQR) | 5.8% | 27.7% |
| Standard Deviation (Sample) | 6.8% | 25.5% |
| Standard Deviation (Population) | 6.7% | 24.9% |
Similar Demographics by Unemployment Among Ages 25 to 29 years
Demographics Similar to Africans by Unemployment Among Ages 25 to 29 years
In terms of unemployment among ages 25 to 29 years, the demographic groups most similar to Africans are Immigrants from Mexico (7.6%, a difference of 0.060%), Vietnamese (7.6%, a difference of 0.65%), Belizean (7.7%, a difference of 0.71%), Senegalese (7.6%, a difference of 0.74%), and Armenian (7.7%, a difference of 0.81%).
| Demographics | Rating | Rank | Unemployment Among Ages 25 to 29 years |
| Immigrants | Bangladesh | 0.0 /100 | #281 | Tragic 7.5% |
| Immigrants | Senegal | 0.0 /100 | #282 | Tragic 7.6% |
| Creek | 0.0 /100 | #283 | Tragic 7.6% |
| Cherokee | 0.0 /100 | #284 | Tragic 7.6% |
| Senegalese | 0.0 /100 | #285 | Tragic 7.6% |
| Vietnamese | 0.0 /100 | #286 | Tragic 7.6% |
| Immigrants | Mexico | 0.0 /100 | #287 | Tragic 7.6% |
| Africans | 0.0 /100 | #288 | Tragic 7.6% |
| Belizeans | 0.0 /100 | #289 | Tragic 7.7% |
| Armenians | 0.0 /100 | #290 | Tragic 7.7% |
| Hispanics or Latinos | 0.0 /100 | #291 | Tragic 7.7% |
| Chippewa | 0.0 /100 | #292 | Tragic 7.8% |
| Immigrants | Belize | 0.0 /100 | #293 | Tragic 7.8% |
| Trinidadians and Tobagonians | 0.0 /100 | #294 | Tragic 7.8% |
| Comanche | 0.0 /100 | #295 | Tragic 7.8% |
Demographics Similar to Crow by Unemployment Among Ages 25 to 29 years
In terms of unemployment among ages 25 to 29 years, the demographic groups most similar to Crow are Arapaho (15.4%, a difference of 0.070%), Hopi (13.5%, a difference of 13.8%), Inupiat (13.4%, a difference of 14.5%), Yup'ik (17.9%, a difference of 16.6%), and Navajo (12.2%, a difference of 26.3%).
| Demographics | Rating | Rank | Unemployment Among Ages 25 to 29 years |
| Alaskan Athabascans | 0.0 /100 | #333 | Tragic 10.8% |
| Yuman | 0.0 /100 | #334 | Tragic 11.0% |
| Puerto Ricans | 0.0 /100 | #335 | Tragic 11.1% |
| Lumbee | 0.0 /100 | #336 | Tragic 11.2% |
| Menominee | 0.0 /100 | #337 | Tragic 11.3% |
| Sioux | 0.0 /100 | #338 | Tragic 11.7% |
| Pima | 0.0 /100 | #339 | Tragic 11.8% |
| Cheyenne | 0.0 /100 | #340 | Tragic 11.8% |
| Tohono O'odham | 0.0 /100 | #341 | Tragic 12.1% |
| Navajo | 0.0 /100 | #342 | Tragic 12.2% |
| Inupiat | 0.0 /100 | #343 | Tragic 13.4% |
| Hopi | 0.0 /100 | #344 | Tragic 13.5% |
| Arapaho | 0.0 /100 | #345 | Tragic 15.4% |
| Crow | 0.0 /100 | #346 | Tragic 15.4% |
| Yup'ik | 0.0 /100 | #347 | Tragic 17.9% |