Central American vs Immigrants from Syria Unemployment Among Ages 25 to 29 years
COMPARE
Central American
Immigrants from Syria
Unemployment Among Ages 25 to 29 years
Unemployment Among Ages 25 to 29 years Comparison
Central Americans
Immigrants from Syria
7.0%
UNEMPLOYMENT AMONG AGES 25 TO 29 YEARS
3.0/ 100
METRIC RATING
231st/ 347
METRIC RANK
6.8%
UNEMPLOYMENT AMONG AGES 25 TO 29 YEARS
15.1/ 100
METRIC RATING
213th/ 347
METRIC RANK
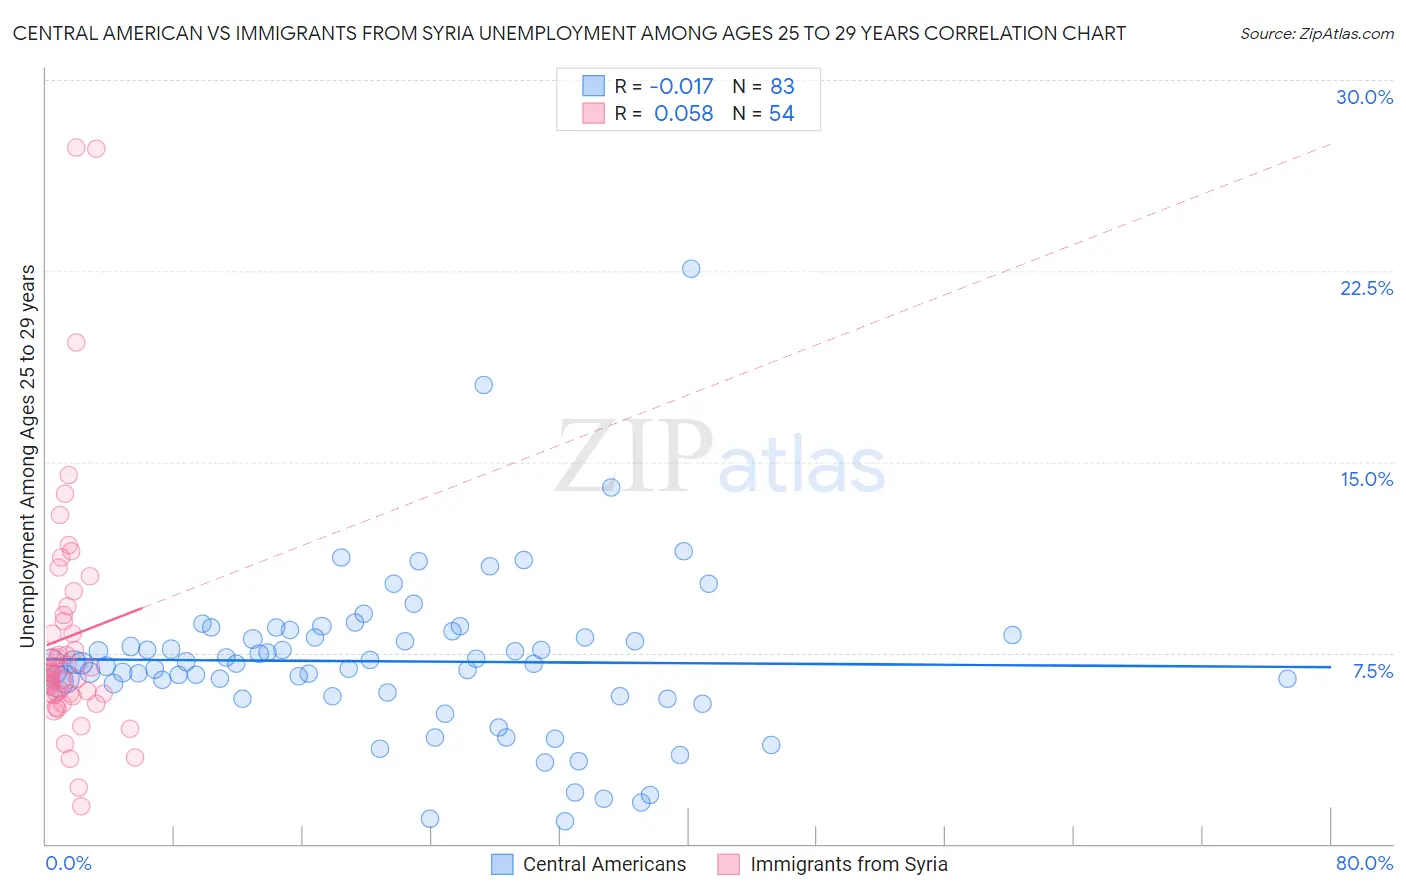
Central American vs Immigrants from Syria Unemployment Among Ages 25 to 29 years Correlation Chart
The statistical analysis conducted on geographies consisting of 469,203,667 people shows no correlation between the proportion of Central Americans and unemployment rate among population between the ages 25 and 29 in the United States with a correlation coefficient (R) of -0.017 and weighted average of 7.0%. Similarly, the statistical analysis conducted on geographies consisting of 170,999,666 people shows a slight positive correlation between the proportion of Immigrants from Syria and unemployment rate among population between the ages 25 and 29 in the United States with a correlation coefficient (R) of 0.058 and weighted average of 6.8%, a difference of 2.6%.
Unemployment Among Ages 25 to 29 years Correlation Summary
| Measurement | Central American | Immigrants from Syria |
| Minimum | 0.90% | 1.5% |
| Maximum | 22.6% | 27.4% |
| Range | 21.7% | 25.9% |
| Mean | 7.2% | 8.1% |
| Median | 7.1% | 6.7% |
| Interquartile 25% (IQ1) | 5.8% | 5.8% |
| Interquartile 75% (IQ3) | 8.2% | 9.0% |
| Interquartile Range (IQR) | 2.4% | 3.1% |
| Standard Deviation (Sample) | 3.2% | 4.9% |
| Standard Deviation (Population) | 3.2% | 4.9% |
Demographics Similar to Central Americans and Immigrants from Syria by Unemployment Among Ages 25 to 29 years
In terms of unemployment among ages 25 to 29 years, the demographic groups most similar to Central Americans are Spanish American (7.0%, a difference of 0.15%), Immigrants from El Salvador (7.0%, a difference of 0.29%), Bermudan (7.0%, a difference of 0.37%), Immigrants from Panama (7.0%, a difference of 0.52%), and Salvadoran (7.0%, a difference of 0.58%). Similarly, the demographic groups most similar to Immigrants from Syria are Liberian (6.8%, a difference of 0.050%), Spanish (6.8%, a difference of 0.080%), Slovak (6.8%, a difference of 0.10%), Immigrants from Cabo Verde (6.8%, a difference of 0.12%), and Ute (6.8%, a difference of 0.21%).
| Demographics | Rating | Rank | Unemployment Among Ages 25 to 29 years |
| Immigrants | Cabo Verde | 16.2 /100 | #212 | Poor 6.8% |
| Immigrants | Syria | 15.1 /100 | #213 | Poor 6.8% |
| Liberians | 14.7 /100 | #214 | Poor 6.8% |
| Spanish | 14.4 /100 | #215 | Poor 6.8% |
| Slovaks | 14.3 /100 | #216 | Poor 6.8% |
| Ute | 13.4 /100 | #217 | Poor 6.8% |
| Immigrants | Austria | 12.3 /100 | #218 | Poor 6.8% |
| Whites/Caucasians | 10.6 /100 | #219 | Poor 6.9% |
| French | 10.5 /100 | #220 | Poor 6.9% |
| Israelis | 9.8 /100 | #221 | Tragic 6.9% |
| Spaniards | 7.7 /100 | #222 | Tragic 6.9% |
| Celtics | 7.6 /100 | #223 | Tragic 6.9% |
| Immigrants | Immigrants | 6.2 /100 | #224 | Tragic 6.9% |
| Japanese | 5.4 /100 | #225 | Tragic 6.9% |
| Immigrants | Liberia | 4.8 /100 | #226 | Tragic 7.0% |
| Salvadorans | 4.4 /100 | #227 | Tragic 7.0% |
| Immigrants | Panama | 4.2 /100 | #228 | Tragic 7.0% |
| Bermudans | 3.8 /100 | #229 | Tragic 7.0% |
| Immigrants | El Salvador | 3.6 /100 | #230 | Tragic 7.0% |
| Central Americans | 3.0 /100 | #231 | Tragic 7.0% |
| Spanish Americans | 2.7 /100 | #232 | Tragic 7.0% |