Central American vs Immigrants from Syria Child Poverty Among Boys Under 16
COMPARE
Central American
Immigrants from Syria
Child Poverty Among Boys Under 16
Child Poverty Among Boys Under 16 Comparison
Central Americans
Immigrants from Syria
20.1%
CHILD POVERTY AMONG BOYS UNDER 16
0.0/ 100
METRIC RATING
280th/ 347
METRIC RANK
16.5%
CHILD POVERTY AMONG BOYS UNDER 16
49.0/ 100
METRIC RATING
175th/ 347
METRIC RANK
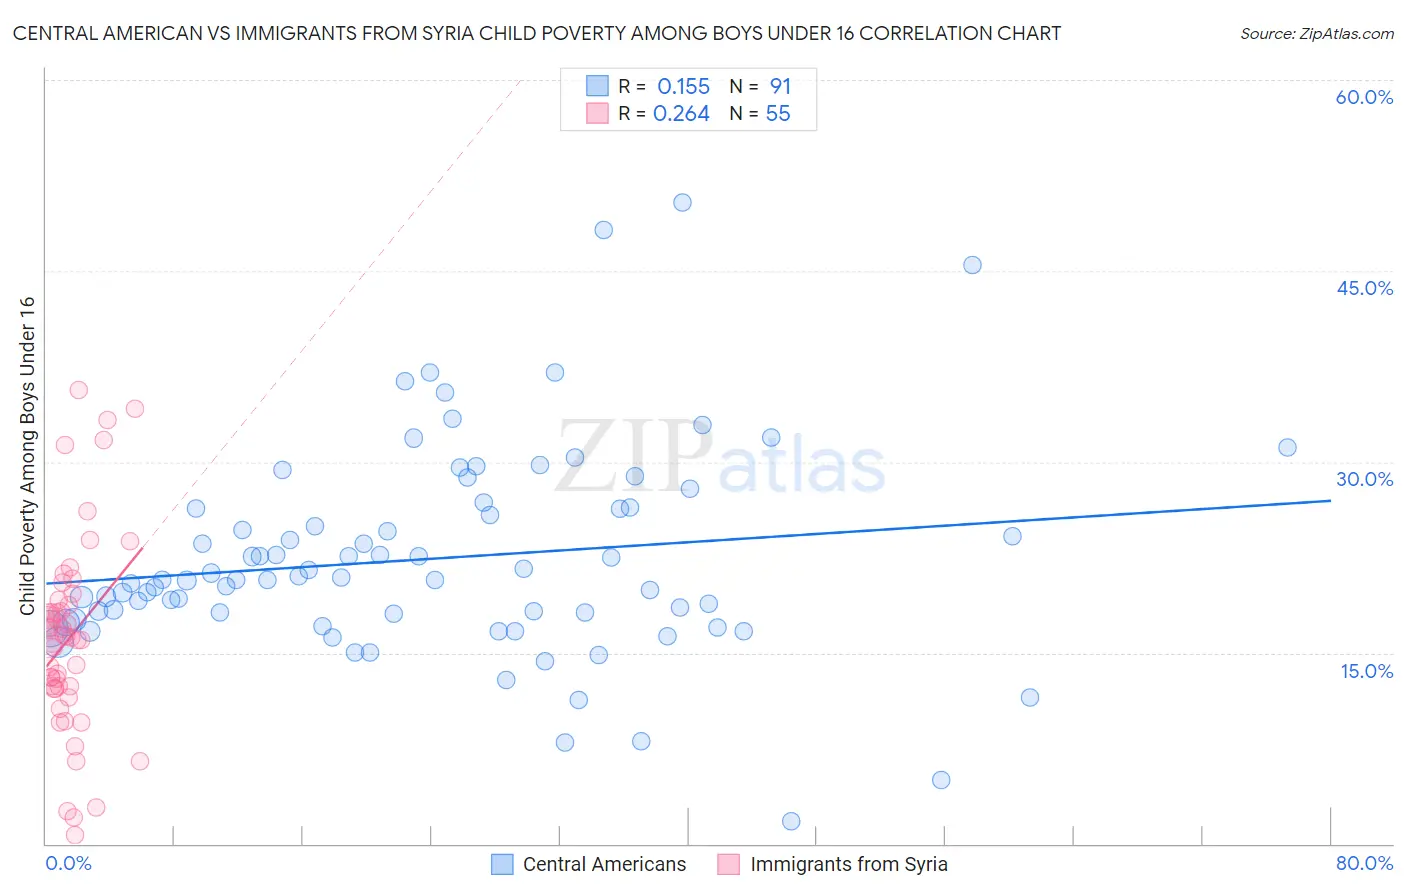
Central American vs Immigrants from Syria Child Poverty Among Boys Under 16 Correlation Chart
The statistical analysis conducted on geographies consisting of 494,011,112 people shows a poor positive correlation between the proportion of Central Americans and poverty level among boys under the age of 16 in the United States with a correlation coefficient (R) of 0.155 and weighted average of 20.1%. Similarly, the statistical analysis conducted on geographies consisting of 173,156,396 people shows a weak positive correlation between the proportion of Immigrants from Syria and poverty level among boys under the age of 16 in the United States with a correlation coefficient (R) of 0.264 and weighted average of 16.5%, a difference of 21.9%.
Child Poverty Among Boys Under 16 Correlation Summary
| Measurement | Central American | Immigrants from Syria |
| Minimum | 1.7% | 0.70% |
| Maximum | 50.4% | 35.6% |
| Range | 48.6% | 34.9% |
| Mean | 22.4% | 16.2% |
| Median | 20.7% | 16.2% |
| Interquartile 25% (IQ1) | 17.6% | 12.2% |
| Interquartile 75% (IQ3) | 26.3% | 19.2% |
| Interquartile Range (IQR) | 8.8% | 7.0% |
| Standard Deviation (Sample) | 8.2% | 7.7% |
| Standard Deviation (Population) | 8.2% | 7.6% |
Similar Demographics by Child Poverty Among Boys Under 16
Demographics Similar to Central Americans by Child Poverty Among Boys Under 16
In terms of child poverty among boys under 16, the demographic groups most similar to Central Americans are Immigrants from Zaire (20.1%, a difference of 0.060%), Comanche (20.1%, a difference of 0.11%), Bangladeshi (20.0%, a difference of 0.12%), Immigrants from Jamaica (20.1%, a difference of 0.24%), and Immigrants from West Indies (20.0%, a difference of 0.25%).
| Demographics | Rating | Rank | Child Poverty Among Boys Under 16 |
| Belizeans | 0.1 /100 | #273 | Tragic 19.9% |
| Immigrants | Bangladesh | 0.0 /100 | #274 | Tragic 19.9% |
| Jamaicans | 0.0 /100 | #275 | Tragic 20.0% |
| Sub-Saharan Africans | 0.0 /100 | #276 | Tragic 20.0% |
| Immigrants | Barbados | 0.0 /100 | #277 | Tragic 20.0% |
| Immigrants | West Indies | 0.0 /100 | #278 | Tragic 20.0% |
| Bangladeshis | 0.0 /100 | #279 | Tragic 20.0% |
| Central Americans | 0.0 /100 | #280 | Tragic 20.1% |
| Immigrants | Zaire | 0.0 /100 | #281 | Tragic 20.1% |
| Comanche | 0.0 /100 | #282 | Tragic 20.1% |
| Immigrants | Jamaica | 0.0 /100 | #283 | Tragic 20.1% |
| Barbadians | 0.0 /100 | #284 | Tragic 20.2% |
| Arapaho | 0.0 /100 | #285 | Tragic 20.2% |
| West Indians | 0.0 /100 | #286 | Tragic 20.3% |
| Immigrants | Belize | 0.0 /100 | #287 | Tragic 20.3% |
Demographics Similar to Immigrants from Syria by Child Poverty Among Boys Under 16
In terms of child poverty among boys under 16, the demographic groups most similar to Immigrants from Syria are White/Caucasian (16.5%, a difference of 0.090%), Uruguayan (16.4%, a difference of 0.11%), Ethiopian (16.5%, a difference of 0.14%), Tsimshian (16.4%, a difference of 0.16%), and Scotch-Irish (16.5%, a difference of 0.17%).
| Demographics | Rating | Rank | Child Poverty Among Boys Under 16 |
| South Americans | 55.3 /100 | #168 | Average 16.3% |
| Immigrants | Saudi Arabia | 53.6 /100 | #169 | Average 16.4% |
| Immigrants | Bosnia and Herzegovina | 51.7 /100 | #170 | Average 16.4% |
| Immigrants | Ethiopia | 51.3 /100 | #171 | Average 16.4% |
| Immigrants | Colombia | 50.8 /100 | #172 | Average 16.4% |
| Tsimshian | 50.5 /100 | #173 | Average 16.4% |
| Uruguayans | 50.0 /100 | #174 | Average 16.4% |
| Immigrants | Syria | 49.0 /100 | #175 | Average 16.5% |
| Whites/Caucasians | 48.2 /100 | #176 | Average 16.5% |
| Ethiopians | 47.8 /100 | #177 | Average 16.5% |
| Scotch-Irish | 47.5 /100 | #178 | Average 16.5% |
| Hungarians | 47.3 /100 | #179 | Average 16.5% |
| Hawaiians | 45.5 /100 | #180 | Average 16.5% |
| South American Indians | 44.3 /100 | #181 | Average 16.5% |
| Lebanese | 43.3 /100 | #182 | Average 16.6% |