Carpatho Rusyn vs Immigrants from South Eastern Asia Unemployment Among Ages 16 to 19 years

COMPARE

Carpatho Rusyn
Race
Ancestry
AfghanAfricanAlaska NativeAlaskan AthabascanAlbanianAleutAlsatianAmericanApacheArabArapahoArgentineanArmenianAssyrian/Chaldean/SyriacAustralianAustrianBahamianBangladeshiBarbadianBasqueBelgianBelizeanBermudanBhutaneseBlackfeetBolivianBrazilianBritishBritish West IndianBulgarianBurmeseCajunCambodianCanadianCape VerdeanCarpatho RusynCelticCentral AmericanCentral American IndianCherokeeCheyenneChickasawChileanChineseChippewaChoctawColombianColvilleComancheCosta RicanCreeCreekCroatianCrowCubanCypriotCzechCzechoslovakianDanishDelawareDominicanDutchDutch West IndianEastern EuropeanEcuadorianEgyptianEnglishEstonianEthiopianEuropeanFijianFilipinoFinnishFrenchFrench American IndianFrench CanadianGermanGerman RussianGhanaianGreekGuamanian/ChamorroGuatemalanGuyaneseHaitianHmongHonduranHopiHoumaHungarianIcelanderIndian (Asian)IndonesianInupiatIranianIraqiIrishIroquoisIsraeliItalianJamaicanJapaneseJordanianKenyanKiowaKoreanLaotianLatvianLebaneseLiberianLithuanianLumbeeLuxembourgerMacedonianMalaysianMalteseMarshalleseMenomineeMexicanMexican American IndianMongolianMoroccanNative HawaiianNavajoNepaleseNew ZealanderNicaraguanNigerianNorthern EuropeanNorwegianOkinawanOsageOttawaPaiutePakistaniPalestinianPanamanianParaguayanPennsylvania GermanPeruvianPimaPolishPortuguesePotawatomiPuebloPuerto RicanPuget Sound SalishRomanianRussianSalvadoranSamoanScandinavianScotch-IrishScottishSeminoleSenegaleseSerbianShoshoneSierra LeoneanSiouxSlavicSlovakSloveneSomaliSouth AfricanSouth AmericanSouth American IndianSoviet UnionSpaniardSpanishSpanish AmericanSpanish American IndianSri LankanSubsaharan AfricanSudaneseSwedishSwissSyrianTaiwaneseThaiTlingit-HaidaTohono O'OdhamTonganTrinidadian and TobagonianTsimshianTurkishU.S. Virgin IslanderUgandanUkrainianUruguayanUteVenezuelanVietnameseWelshWest IndianYakamaYaquiYugoslavianYumanYup'ikZimbabwean
Immigration
NonimmigrantsImmigrantsAfghanistanAfricaAlbaniaArgentinaArmeniaAsiaAustraliaAustriaBahamasBangladeshBarbadosBelarusBelgiumBelizeBoliviaBosnia and HerzegovinaBrazilBulgariaBurma/MyanmarCabo VerdeCambodiaCameroonCanadaCaribbeanCentral AmericaChileChinaColombiaCongoCosta RicaCroatiaCubaCzechoslovakiaDenmarkDominicaDominican RepublicEastern AfricaEastern AsiaEastern EuropeEcuadorEgyptEl SalvadorEnglandEritreaEthiopiaEuropeFijiFranceGermanyGhanaGreeceGrenadaGuatemalaGuyanaHaitiHondurasHong KongHungaryIndiaIndonesiaIranIraqIrelandIsraelItalyJamaicaJapanJordanKazakhstanKenyaKoreaKuwaitLaosLatin AmericaLatviaLebanonLiberiaLithuaniaMalaysiaMexicoMicronesiaMiddle AfricaMoldovaMoroccoNepalNetherlandsNicaraguaNigeriaNorth AmericaNorth MacedoniaNorthern AfricaNorthern EuropeNorwayOceaniaPakistanPanamaPeruPhilippinesPolandPortugalRomaniaRussiaSaudi ArabiaScotlandSenegalSerbiaSierra LeoneSingaporeSomaliaSouth AfricaSouth AmericaSouth Central AsiaSouthern EuropeSpainSri LankaSt. Vincent and the GrenadinesSudanSwedenSwitzerlandSyriaTaiwanThailandTrinidad and TobagoTurkeyUgandaUkraineUruguayUzbekistanVenezuelaVietnamWest IndiesWestern AfricaWestern AsiaWestern EuropeYemenZaireZimbabweAzores
Immigrants from South Eastern Asia
Race
Ancestry
AfghanAfricanAlaska NativeAlaskan AthabascanAlbanianAleutAlsatianAmericanApacheArabArapahoArgentineanArmenianAssyrian/Chaldean/SyriacAustralianAustrianBahamianBangladeshiBarbadianBasqueBelgianBelizeanBermudanBhutaneseBlackfeetBolivianBrazilianBritishBritish West IndianBulgarianBurmeseCajunCambodianCanadianCape VerdeanCelticCentral AmericanCentral American IndianCherokeeCheyenneChickasawChileanChineseChippewaChoctawColombianColvilleComancheCosta RicanCreeCreekCroatianCrowCubanCypriotCzechCzechoslovakianDanishDelawareDominicanDutchDutch West IndianEastern EuropeanEcuadorianEgyptianEnglishEstonianEthiopianEuropeanFijianFilipinoFinnishFrenchFrench American IndianFrench CanadianGermanGerman RussianGhanaianGreekGuamanian/ChamorroGuatemalanGuyaneseHaitianHmongHonduranHopiHoumaHungarianIcelanderIndian (Asian)IndonesianInupiatIranianIraqiIrishIroquoisIsraeliItalianJamaicanJapaneseJordanianKenyanKiowaKoreanLaotianLatvianLebaneseLiberianLithuanianLumbeeLuxembourgerMacedonianMalaysianMalteseMarshalleseMenomineeMexicanMexican American IndianMongolianMoroccanNative HawaiianNavajoNepaleseNew ZealanderNicaraguanNigerianNorthern EuropeanNorwegianOkinawanOsageOttawaPaiutePakistaniPalestinianPanamanianParaguayanPennsylvania GermanPeruvianPimaPolishPortuguesePotawatomiPuebloPuerto RicanPuget Sound SalishRomanianRussianSalvadoranSamoanScandinavianScotch-IrishScottishSeminoleSenegaleseSerbianShoshoneSierra LeoneanSiouxSlavicSlovakSloveneSomaliSouth AfricanSouth AmericanSouth American IndianSoviet UnionSpaniardSpanishSpanish AmericanSpanish American IndianSri LankanSubsaharan AfricanSudaneseSwedishSwissSyrianTaiwaneseThaiTlingit-HaidaTohono O'OdhamTonganTrinidadian and TobagonianTsimshianTurkishU.S. Virgin IslanderUgandanUkrainianUruguayanUteVenezuelanVietnameseWelshWest IndianYakamaYaquiYugoslavianYumanYup'ikZimbabwean
Immigration
NonimmigrantsImmigrantsAfghanistanAfricaAlbaniaArgentinaArmeniaAsiaAustraliaAustriaBahamasBangladeshBarbadosBelarusBelgiumBelizeBoliviaBosnia and HerzegovinaBrazilBulgariaBurma/MyanmarCabo VerdeCambodiaCameroonCanadaCaribbeanCentral AmericaChileChinaColombiaCongoCosta RicaCroatiaCubaCzechoslovakiaDenmarkDominicaDominican RepublicEastern AfricaEastern AsiaEastern EuropeEcuadorEgyptEl SalvadorEnglandEritreaEthiopiaEuropeFijiFranceGermanyGhanaGreeceGrenadaGuatemalaGuyanaHaitiHondurasHong KongHungaryIndiaIndonesiaIranIraqIrelandIsraelItalyJamaicaJapanJordanKazakhstanKenyaKoreaKuwaitLaosLatin AmericaLatviaLebanonLiberiaLithuaniaMalaysiaMexicoMicronesiaMiddle AfricaMoldovaMoroccoNepalNetherlandsNicaraguaNigeriaNorth AmericaNorth MacedoniaNorthern AfricaNorthern EuropeNorwayOceaniaPakistanPanamaPeruPhilippinesPolandPortugalRomaniaRussiaSaudi ArabiaScotlandSenegalSerbiaSierra LeoneSingaporeSomaliaSouth AfricaSouth AmericaSouth Central AsiaSouth Eastern AsiaSouthern EuropeSpainSri LankaSt. Vincent and the GrenadinesSudanSwedenSwitzerlandSyriaTaiwanThailandTrinidad and TobagoTurkeyUgandaUkraineUruguayUzbekistanVenezuelaVietnamWest IndiesWestern AfricaWestern AsiaWestern EuropeYemenZaireZimbabweAzores
Unemployment Among Ages 16 to 19 years
Income
Poverty
Unemployment
Labor Participation
Family Structure
Vehicle Availability
Education Level
Disability

Unemployment Among Ages 16 to 19 years Comparison

Carpatho Rusyns

Immigrants from South Eastern Asia

Poor
Exceptional
17.9%
UNEMPLOYMENT AMONG AGES 16 TO 19 YEARS
15.6/ 100
METRIC RATING
210th/ 347
METRIC RANK
17.1%
UNEMPLOYMENT AMONG AGES 16 TO 19 YEARS
90.7/ 100
METRIC RATING
122nd/ 347
METRIC RANK

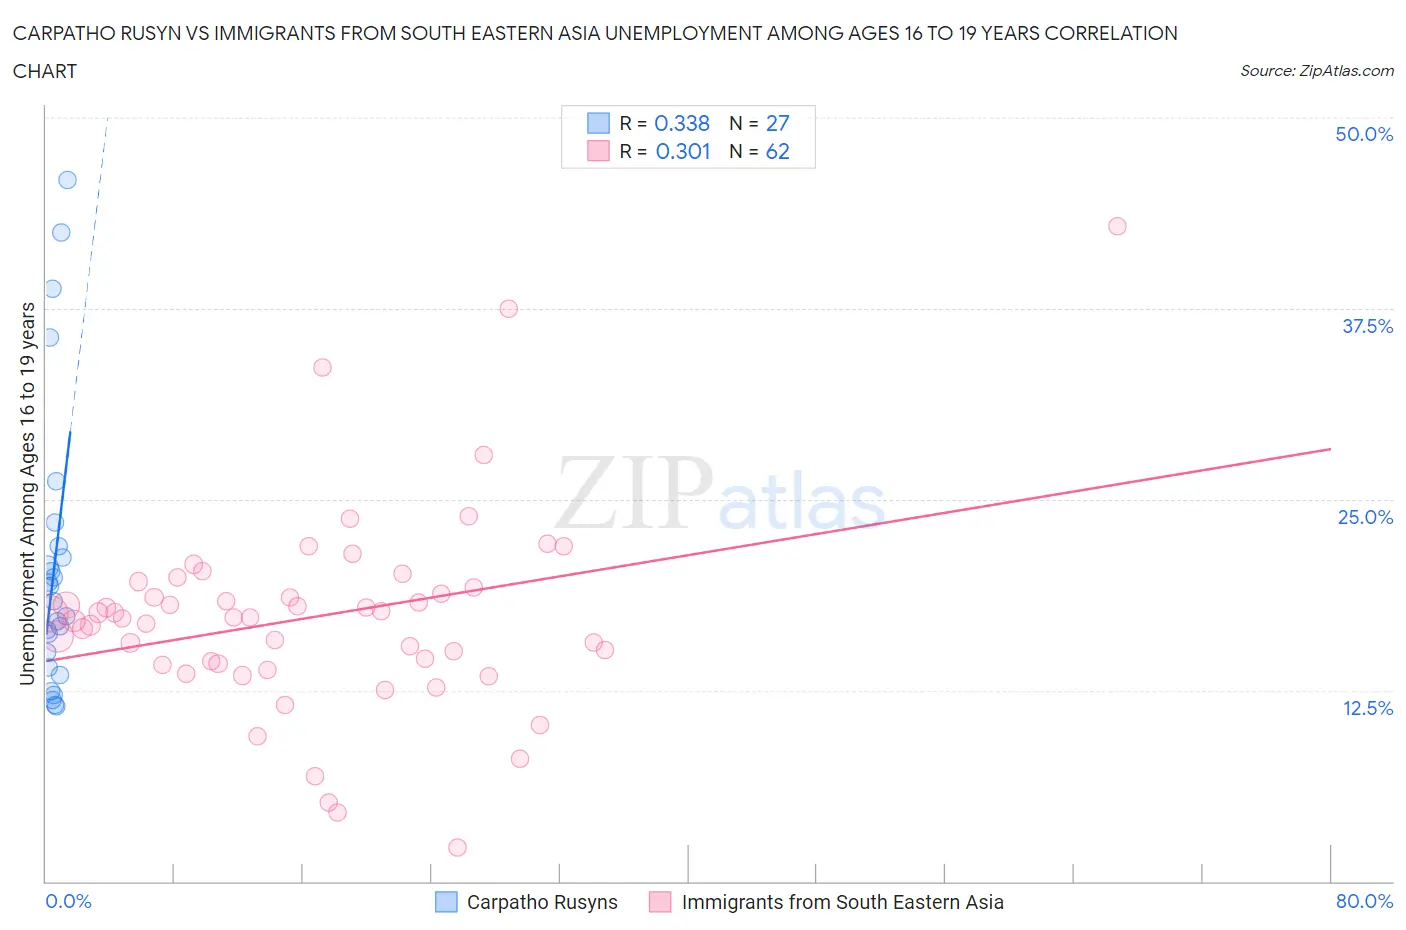
Carpatho Rusyn vs Immigrants from South Eastern Asia Unemployment Among Ages 16 to 19 years Correlation Chart

The statistical analysis conducted on geographies consisting of 57,767,385 people shows a mild positive correlation between the proportion of Carpatho Rusyns and unemployment rate among population between the ages 16 and 19 in the United States with a correlation coefficient (R) of 0.338 and weighted average of 17.9%. Similarly, the statistical analysis conducted on geographies consisting of 473,939,844 people shows a mild positive correlation between the proportion of Immigrants from South Eastern Asia and unemployment rate among population between the ages 16 and 19 in the United States with a correlation coefficient (R) of 0.301 and weighted average of 17.1%, a difference of 4.8%.
Carpatho Rusyn vs Immigrants from South Eastern Asia Unemployment Among Ages 16 to 19 years

Unemployment Among Ages 16 to 19 years Correlation Summary

MeasurementCarpatho RusynImmigrants from South Eastern Asia
Minimum11.5%2.2%
Maximum45.9%42.9%
Range34.4%40.7%
Mean20.7%17.3%
Median18.3%17.3%
Interquartile 25% (IQ1)14.0%14.2%
Interquartile 75% (IQ3)21.9%19.2%
Interquartile Range (IQR)7.9%5.0%
Standard Deviation (Sample)9.4%6.7%
Standard Deviation (Population)9.2%6.6%

Similar Demographics by Unemployment Among Ages 16 to 19 years

Demographics Similar to Carpatho Rusyns by Unemployment Among Ages 16 to 19 years

In terms of unemployment among ages 16 to 19 years, the demographic groups most similar to Carpatho Rusyns are Cherokee (17.9%, a difference of 0.010%), Hawaiian (17.9%, a difference of 0.10%), Guamanian/Chamorro (17.9%, a difference of 0.10%), Argentinean (18.0%, a difference of 0.16%), and Chippewa (18.0%, a difference of 0.17%).
DemographicsRating | RankUnemployment Among Ages 16 to 19 years
Immigrants | Eastern Europe
23.6
/100
|
#203
Fair
17.8%
Immigrants | Nonimmigrants
20.9
/100
|
#204
Fair
17.9%
Assyrians/Chaldeans/Syriacs
20.8
/100
|
#205
Fair
17.9%
Immigrants | Southern Europe
18.9
/100
|
#206
Poor
17.9%
Liberians
18.6
/100
|
#207
Poor
17.9%
Hawaiians
16.8
/100
|
#208
Poor
17.9%
Cherokee
15.7
/100
|
#209
Poor
17.9%
Carpatho Rusyns
15.6
/100
|
#210
Poor
17.9%
Guamanians/Chamorros
14.5
/100
|
#211
Poor
17.9%
Argentineans
13.8
/100
|
#212
Poor
18.0%
Chippewa
13.7
/100
|
#213
Poor
18.0%
Immigrants | Morocco
13.5
/100
|
#214
Poor
18.0%
Immigrants | Syria
13.3
/100
|
#215
Poor
18.0%
Immigrants | Kazakhstan
13.0
/100
|
#216
Poor
18.0%
South American Indians
13.0
/100
|
#217
Poor
18.0%

Demographics Similar to Immigrants from South Eastern Asia by Unemployment Among Ages 16 to 19 years

In terms of unemployment among ages 16 to 19 years, the demographic groups most similar to Immigrants from South Eastern Asia are Immigrants from Moldova (17.1%, a difference of 0.010%), Immigrants from Middle Africa (17.1%, a difference of 0.030%), Hungarian (17.1%, a difference of 0.14%), Venezuelan (17.1%, a difference of 0.18%), and Immigrants from Sri Lanka (17.1%, a difference of 0.20%).
DemographicsRating | RankUnemployment Among Ages 16 to 19 years
Brazilians
92.3
/100
|
#115
Exceptional
17.1%
Immigrants | Korea
92.2
/100
|
#116
Exceptional
17.1%
Immigrants | Sri Lanka
92.0
/100
|
#117
Exceptional
17.1%
Venezuelans
91.8
/100
|
#118
Exceptional
17.1%
Hungarians
91.6
/100
|
#119
Exceptional
17.1%
Immigrants | Middle Africa
90.9
/100
|
#120
Exceptional
17.1%
Immigrants | Moldova
90.7
/100
|
#121
Exceptional
17.1%
Immigrants | South Eastern Asia
90.7
/100
|
#122
Exceptional
17.1%
Immigrants | Laos
88.8
/100
|
#123
Excellent
17.1%
Syrians
88.6
/100
|
#124
Excellent
17.1%
Immigrants | Germany
87.7
/100
|
#125
Excellent
17.2%
Immigrants | Bolivia
86.7
/100
|
#126
Excellent
17.2%
Pakistanis
85.8
/100
|
#127
Excellent
17.2%
Australians
85.6
/100
|
#128
Excellent
17.2%
Creek
85.5
/100
|
#129
Excellent
17.2%