Carpatho Rusyn vs Immigrants from South Eastern Asia Average Family Size
COMPARE
Carpatho Rusyn
Immigrants from South Eastern Asia
Average Family Size
Average Family Size Comparison
Carpatho Rusyns
Immigrants from South Eastern Asia
3.06
AVERAGE FAMILY SIZE
0.0/ 100
METRIC RATING
347th/ 347
METRIC RANK
3.36
AVERAGE FAMILY SIZE
100.0/ 100
METRIC RATING
54th/ 347
METRIC RANK
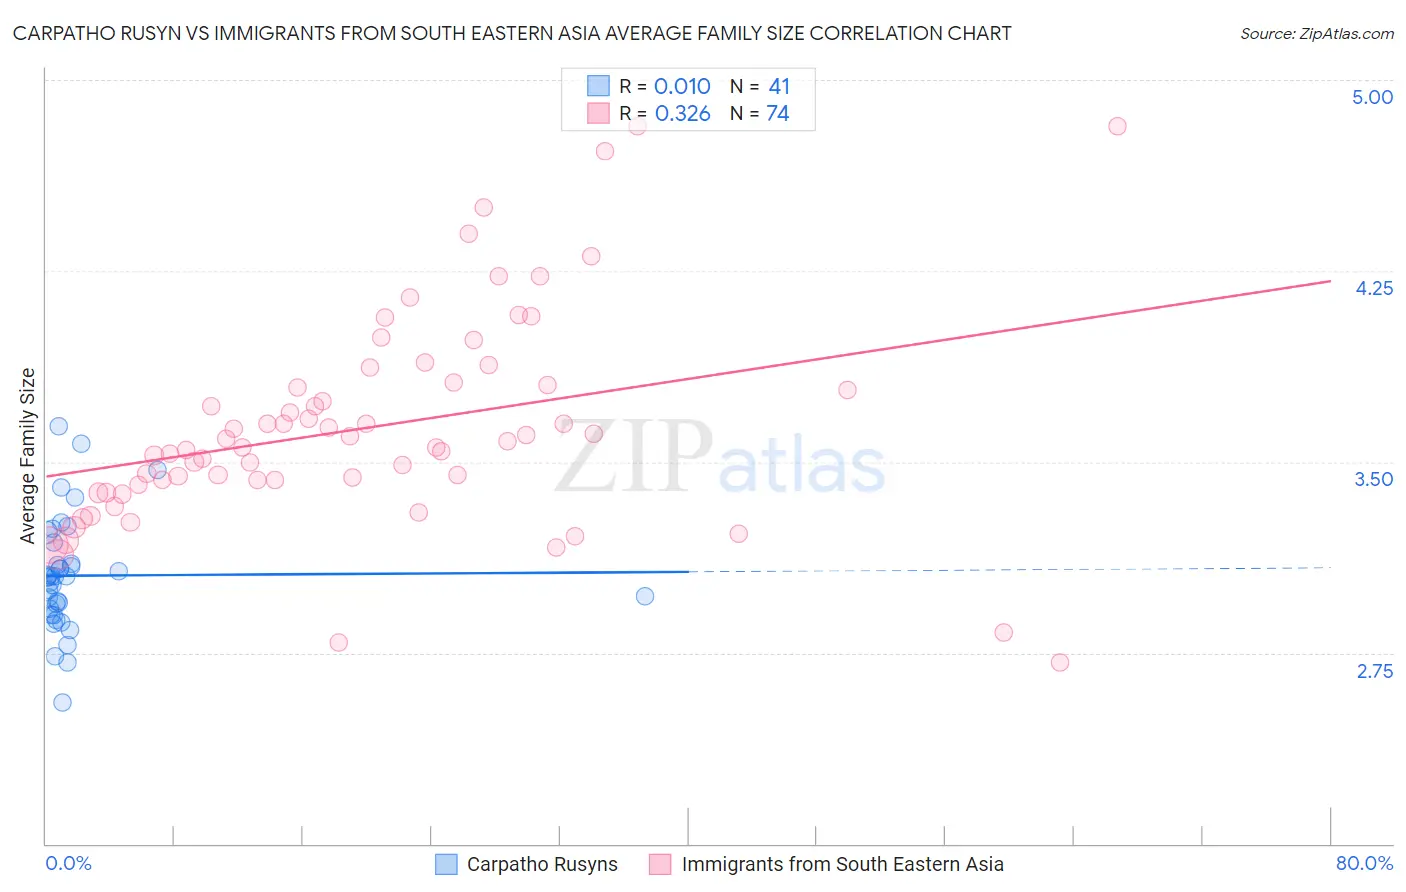
Carpatho Rusyn vs Immigrants from South Eastern Asia Average Family Size Correlation Chart
The statistical analysis conducted on geographies consisting of 58,871,605 people shows no correlation between the proportion of Carpatho Rusyns and average family size in the United States with a correlation coefficient (R) of 0.010 and weighted average of 3.06. Similarly, the statistical analysis conducted on geographies consisting of 512,233,118 people shows a mild positive correlation between the proportion of Immigrants from South Eastern Asia and average family size in the United States with a correlation coefficient (R) of 0.326 and weighted average of 3.36, a difference of 9.7%.
Average Family Size Correlation Summary
| Measurement | Carpatho Rusyn | Immigrants from South Eastern Asia |
| Minimum | 2.56 | 2.71 |
| Maximum | 3.64 | 4.82 |
| Range | 1.08 | 2.11 |
| Mean | 3.05 | 3.64 |
| Median | 3.05 | 3.57 |
| Interquartile 25% (IQ1) | 2.91 | 3.41 |
| Interquartile 75% (IQ3) | 3.14 | 3.80 |
| Interquartile Range (IQR) | 0.23 | 0.39 |
| Standard Deviation (Sample) | 0.22 | 0.42 |
| Standard Deviation (Population) | 0.22 | 0.42 |
Similar Demographics by Average Family Size
Demographics Similar to Carpatho Rusyns by Average Family Size
In terms of average family size, the demographic groups most similar to Carpatho Rusyns are Slovak (3.06, a difference of 0.060%), Slovene (3.07, a difference of 0.35%), French Canadian (3.07, a difference of 0.39%), Norwegian (3.08, a difference of 0.63%), and German (3.09, a difference of 0.86%).
| Demographics | Rating | Rank | Average Family Size |
| Estonians | 0.0 /100 | #333 | Tragic 3.10 |
| Lithuanians | 0.0 /100 | #334 | Tragic 3.10 |
| Luxembourgers | 0.0 /100 | #335 | Tragic 3.10 |
| Irish | 0.0 /100 | #336 | Tragic 3.10 |
| Swedes | 0.0 /100 | #337 | Tragic 3.10 |
| French | 0.0 /100 | #338 | Tragic 3.10 |
| Croatians | 0.0 /100 | #339 | Tragic 3.10 |
| Finns | 0.0 /100 | #340 | Tragic 3.09 |
| Poles | 0.0 /100 | #341 | Tragic 3.09 |
| Germans | 0.0 /100 | #342 | Tragic 3.09 |
| Norwegians | 0.0 /100 | #343 | Tragic 3.08 |
| French Canadians | 0.0 /100 | #344 | Tragic 3.07 |
| Slovenes | 0.0 /100 | #345 | Tragic 3.07 |
| Slovaks | 0.0 /100 | #346 | Tragic 3.06 |
| Carpatho Rusyns | 0.0 /100 | #347 | Tragic 3.06 |
Demographics Similar to Immigrants from South Eastern Asia by Average Family Size
In terms of average family size, the demographic groups most similar to Immigrants from South Eastern Asia are Korean (3.36, a difference of 0.020%), Immigrants from Honduras (3.36, a difference of 0.040%), Fijian (3.36, a difference of 0.050%), Nicaraguan (3.36, a difference of 0.10%), and Immigrants from Dominican Republic (3.35, a difference of 0.11%).
| Demographics | Rating | Rank | Average Family Size |
| Vietnamese | 100.0 /100 | #47 | Exceptional 3.37 |
| Immigrants | Nicaragua | 100.0 /100 | #48 | Exceptional 3.37 |
| Bangladeshis | 100.0 /100 | #49 | Exceptional 3.37 |
| Immigrants | Bangladesh | 100.0 /100 | #50 | Exceptional 3.36 |
| Nicaraguans | 100.0 /100 | #51 | Exceptional 3.36 |
| Fijians | 100.0 /100 | #52 | Exceptional 3.36 |
| Koreans | 100.0 /100 | #53 | Exceptional 3.36 |
| Immigrants | South Eastern Asia | 100.0 /100 | #54 | Exceptional 3.36 |
| Immigrants | Honduras | 100.0 /100 | #55 | Exceptional 3.36 |
| Immigrants | Dominican Republic | 100.0 /100 | #56 | Exceptional 3.35 |
| Sri Lankans | 100.0 /100 | #57 | Exceptional 3.35 |
| Hondurans | 100.0 /100 | #58 | Exceptional 3.35 |
| Japanese | 100.0 /100 | #59 | Exceptional 3.35 |
| Immigrants | Armenia | 100.0 /100 | #60 | Exceptional 3.35 |
| Central American Indians | 100.0 /100 | #61 | Exceptional 3.35 |