Carpatho Rusyn vs Immigrants from Bahamas Male Unemployment
COMPARE
Carpatho Rusyn
Immigrants from Bahamas
Male Unemployment
Male Unemployment Comparison
Carpatho Rusyns
Immigrants from Bahamas
4.8%
MALE UNEMPLOYMENT
99.9/ 100
METRIC RATING
22nd/ 347
METRIC RANK
5.7%
MALE UNEMPLOYMENT
0.4/ 100
METRIC RATING
250th/ 347
METRIC RANK
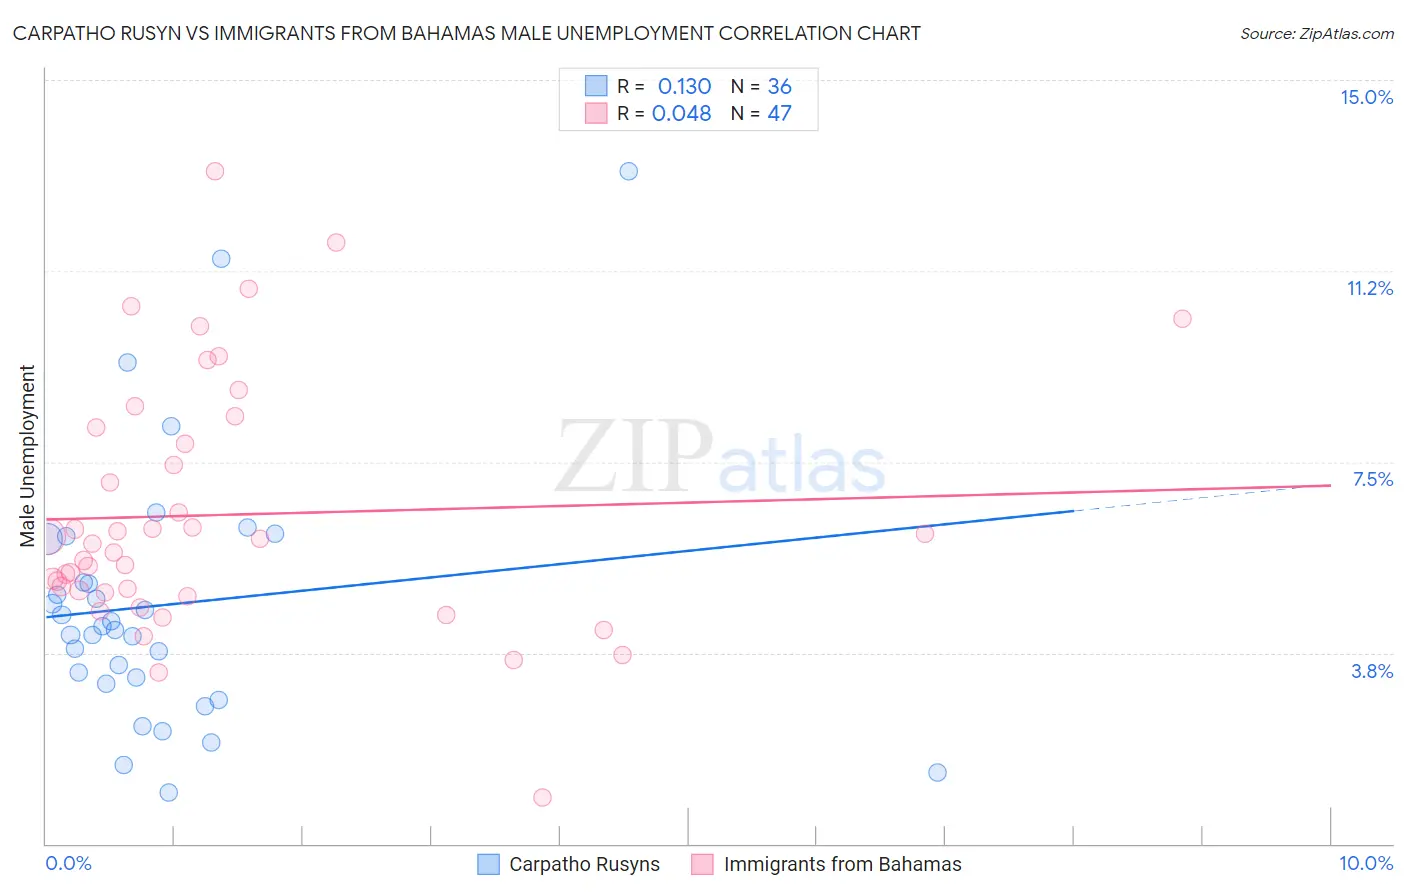
Carpatho Rusyn vs Immigrants from Bahamas Male Unemployment Correlation Chart
The statistical analysis conducted on geographies consisting of 58,814,834 people shows a poor positive correlation between the proportion of Carpatho Rusyns and unemployment rate among males in the United States with a correlation coefficient (R) of 0.130 and weighted average of 4.8%. Similarly, the statistical analysis conducted on geographies consisting of 104,587,349 people shows no correlation between the proportion of Immigrants from Bahamas and unemployment rate among males in the United States with a correlation coefficient (R) of 0.048 and weighted average of 5.7%, a difference of 20.1%.
Male Unemployment Correlation Summary
| Measurement | Carpatho Rusyn | Immigrants from Bahamas |
| Minimum | 1.0% | 0.90% |
| Maximum | 13.2% | 13.2% |
| Range | 12.2% | 12.3% |
| Mean | 4.7% | 6.5% |
| Median | 4.2% | 5.9% |
| Interquartile 25% (IQ1) | 3.2% | 4.9% |
| Interquartile 75% (IQ3) | 5.6% | 8.2% |
| Interquartile Range (IQR) | 2.4% | 3.2% |
| Standard Deviation (Sample) | 2.6% | 2.5% |
| Standard Deviation (Population) | 2.6% | 2.4% |
Similar Demographics by Male Unemployment
Demographics Similar to Carpatho Rusyns by Male Unemployment
In terms of male unemployment, the demographic groups most similar to Carpatho Rusyns are Immigrants from Taiwan (4.8%, a difference of 0.010%), Tongan (4.8%, a difference of 0.040%), Immigrants from South Central Asia (4.8%, a difference of 0.070%), Pennsylvania German (4.8%, a difference of 0.18%), and Zimbabwean (4.8%, a difference of 0.18%).
| Demographics | Rating | Rank | Male Unemployment |
| Scandinavians | 100.0 /100 | #15 | Exceptional 4.7% |
| Swiss | 99.9 /100 | #16 | Exceptional 4.7% |
| Filipinos | 99.9 /100 | #17 | Exceptional 4.7% |
| English | 99.9 /100 | #18 | Exceptional 4.8% |
| Europeans | 99.9 /100 | #19 | Exceptional 4.8% |
| Pennsylvania Germans | 99.9 /100 | #20 | Exceptional 4.8% |
| Immigrants | Taiwan | 99.9 /100 | #21 | Exceptional 4.8% |
| Carpatho Rusyns | 99.9 /100 | #22 | Exceptional 4.8% |
| Tongans | 99.9 /100 | #23 | Exceptional 4.8% |
| Immigrants | South Central Asia | 99.9 /100 | #24 | Exceptional 4.8% |
| Zimbabweans | 99.9 /100 | #25 | Exceptional 4.8% |
| Dutch | 99.9 /100 | #26 | Exceptional 4.8% |
| Belgians | 99.9 /100 | #27 | Exceptional 4.8% |
| Bulgarians | 99.8 /100 | #28 | Exceptional 4.8% |
| Scottish | 99.8 /100 | #29 | Exceptional 4.8% |
Demographics Similar to Immigrants from Bahamas by Male Unemployment
In terms of male unemployment, the demographic groups most similar to Immigrants from Bahamas are Spanish American (5.7%, a difference of 0.040%), Cree (5.7%, a difference of 0.24%), Marshallese (5.7%, a difference of 0.31%), Mexican (5.8%, a difference of 0.62%), and Hawaiian (5.7%, a difference of 0.63%).
| Demographics | Rating | Rank | Male Unemployment |
| Bangladeshis | 0.8 /100 | #243 | Tragic 5.7% |
| Immigrants | El Salvador | 0.7 /100 | #244 | Tragic 5.7% |
| Yaqui | 0.7 /100 | #245 | Tragic 5.7% |
| Iroquois | 0.6 /100 | #246 | Tragic 5.7% |
| Hawaiians | 0.6 /100 | #247 | Tragic 5.7% |
| Marshallese | 0.5 /100 | #248 | Tragic 5.7% |
| Cree | 0.4 /100 | #249 | Tragic 5.7% |
| Immigrants | Bahamas | 0.4 /100 | #250 | Tragic 5.7% |
| Spanish Americans | 0.3 /100 | #251 | Tragic 5.7% |
| Mexicans | 0.2 /100 | #252 | Tragic 5.8% |
| Mexican American Indians | 0.2 /100 | #253 | Tragic 5.8% |
| Japanese | 0.2 /100 | #254 | Tragic 5.8% |
| Kiowa | 0.2 /100 | #255 | Tragic 5.8% |
| Comanche | 0.2 /100 | #256 | Tragic 5.8% |
| Hispanics or Latinos | 0.1 /100 | #257 | Tragic 5.8% |