Alaskan Athabascan vs Immigrants from Bahamas Male Unemployment
COMPARE
Alaskan Athabascan
Immigrants from Bahamas
Male Unemployment
Male Unemployment Comparison
Alaskan Athabascans
Immigrants from Bahamas
9.8%
MALE UNEMPLOYMENT
0.0/ 100
METRIC RATING
340th/ 347
METRIC RANK
5.7%
MALE UNEMPLOYMENT
0.4/ 100
METRIC RATING
250th/ 347
METRIC RANK
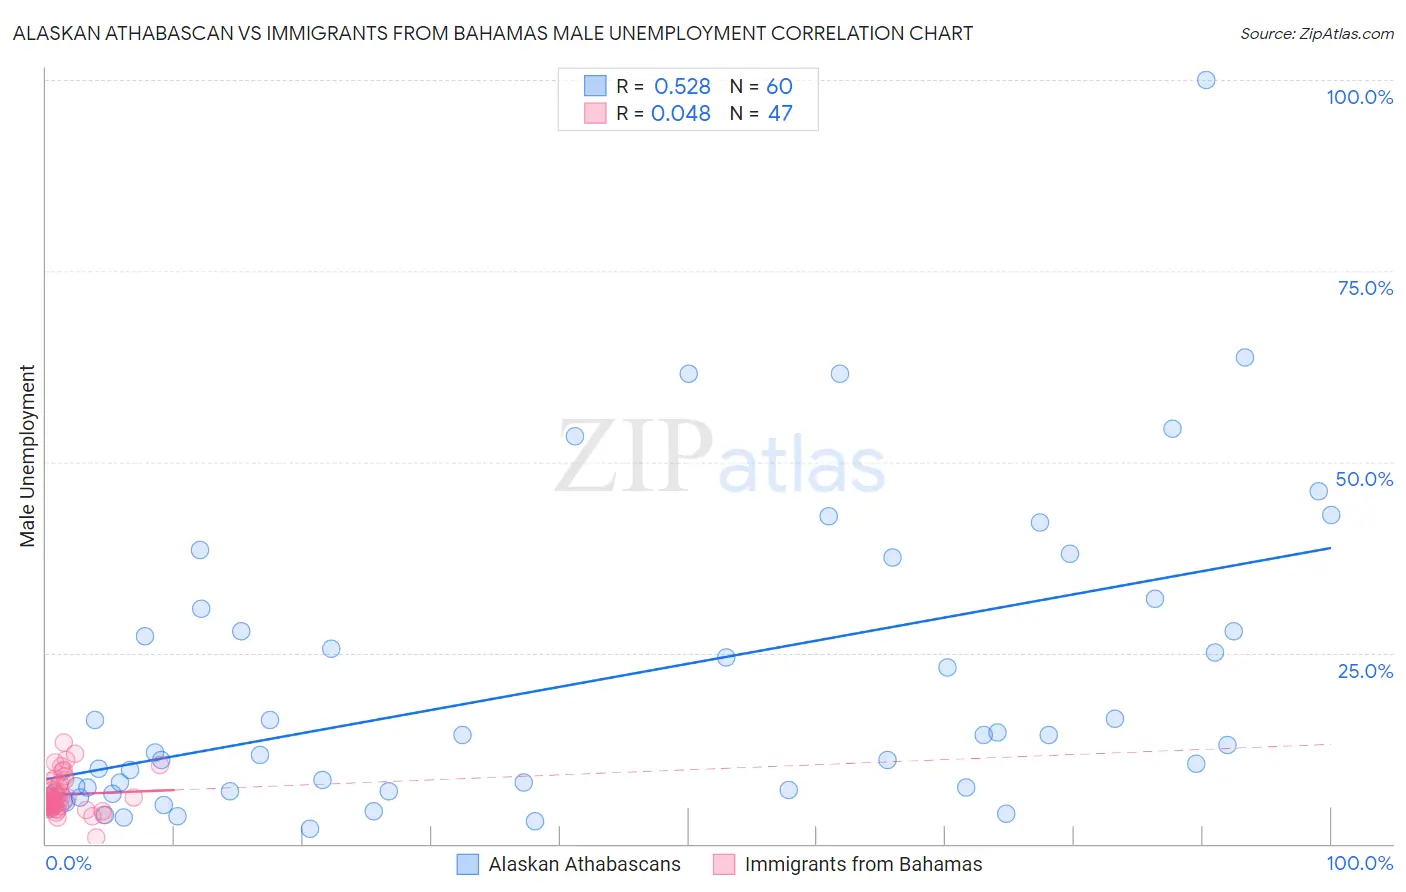
Alaskan Athabascan vs Immigrants from Bahamas Male Unemployment Correlation Chart
The statistical analysis conducted on geographies consisting of 45,763,974 people shows a substantial positive correlation between the proportion of Alaskan Athabascans and unemployment rate among males in the United States with a correlation coefficient (R) of 0.528 and weighted average of 9.8%. Similarly, the statistical analysis conducted on geographies consisting of 104,587,349 people shows no correlation between the proportion of Immigrants from Bahamas and unemployment rate among males in the United States with a correlation coefficient (R) of 0.048 and weighted average of 5.7%, a difference of 71.1%.
Male Unemployment Correlation Summary
| Measurement | Alaskan Athabascan | Immigrants from Bahamas |
| Minimum | 2.0% | 0.90% |
| Maximum | 100.0% | 13.2% |
| Range | 98.0% | 12.3% |
| Mean | 20.9% | 6.5% |
| Median | 12.5% | 5.9% |
| Interquartile 25% (IQ1) | 6.8% | 4.9% |
| Interquartile 75% (IQ3) | 29.4% | 8.2% |
| Interquartile Range (IQR) | 22.5% | 3.2% |
| Standard Deviation (Sample) | 19.9% | 2.5% |
| Standard Deviation (Population) | 19.7% | 2.4% |
Similar Demographics by Male Unemployment
Demographics Similar to Alaskan Athabascans by Male Unemployment
In terms of male unemployment, the demographic groups most similar to Alaskan Athabascans are Cheyenne (9.8%, a difference of 0.080%), Navajo (9.8%, a difference of 0.28%), Tohono O'odham (10.2%, a difference of 3.7%), Crow (10.6%, a difference of 8.2%), and Hopi (10.8%, a difference of 10.0%).
| Demographics | Rating | Rank | Male Unemployment |
| Sioux | 0.0 /100 | #333 | Tragic 8.4% |
| Tsimshian | 0.0 /100 | #334 | Tragic 8.5% |
| Pueblo | 0.0 /100 | #335 | Tragic 8.5% |
| Yuman | 0.0 /100 | #336 | Tragic 8.6% |
| Puerto Ricans | 0.0 /100 | #337 | Tragic 8.6% |
| Apache | 0.0 /100 | #338 | Tragic 8.6% |
| Cheyenne | 0.0 /100 | #339 | Tragic 9.8% |
| Alaskan Athabascans | 0.0 /100 | #340 | Tragic 9.8% |
| Navajo | 0.0 /100 | #341 | Tragic 9.8% |
| Tohono O'odham | 0.0 /100 | #342 | Tragic 10.2% |
| Crow | 0.0 /100 | #343 | Tragic 10.6% |
| Hopi | 0.0 /100 | #344 | Tragic 10.8% |
| Arapaho | 0.0 /100 | #345 | Tragic 11.0% |
| Inupiat | 0.0 /100 | #346 | Tragic 12.1% |
| Yup'ik | 0.0 /100 | #347 | Tragic 16.4% |
Demographics Similar to Immigrants from Bahamas by Male Unemployment
In terms of male unemployment, the demographic groups most similar to Immigrants from Bahamas are Spanish American (5.7%, a difference of 0.040%), Cree (5.7%, a difference of 0.24%), Marshallese (5.7%, a difference of 0.31%), Mexican (5.8%, a difference of 0.62%), and Hawaiian (5.7%, a difference of 0.63%).
| Demographics | Rating | Rank | Male Unemployment |
| Bangladeshis | 0.8 /100 | #243 | Tragic 5.7% |
| Immigrants | El Salvador | 0.7 /100 | #244 | Tragic 5.7% |
| Yaqui | 0.7 /100 | #245 | Tragic 5.7% |
| Iroquois | 0.6 /100 | #246 | Tragic 5.7% |
| Hawaiians | 0.6 /100 | #247 | Tragic 5.7% |
| Marshallese | 0.5 /100 | #248 | Tragic 5.7% |
| Cree | 0.4 /100 | #249 | Tragic 5.7% |
| Immigrants | Bahamas | 0.4 /100 | #250 | Tragic 5.7% |
| Spanish Americans | 0.3 /100 | #251 | Tragic 5.7% |
| Mexicans | 0.2 /100 | #252 | Tragic 5.8% |
| Mexican American Indians | 0.2 /100 | #253 | Tragic 5.8% |
| Japanese | 0.2 /100 | #254 | Tragic 5.8% |
| Kiowa | 0.2 /100 | #255 | Tragic 5.8% |
| Comanche | 0.2 /100 | #256 | Tragic 5.8% |
| Hispanics or Latinos | 0.1 /100 | #257 | Tragic 5.8% |