Cambodian vs Crow Unemployment Among Ages 16 to 19 years
COMPARE
Cambodian
Crow
Unemployment Among Ages 16 to 19 years
Unemployment Among Ages 16 to 19 years Comparison
Cambodians
Crow
16.9%
UNEMPLOYMENT AMONG AGES 16 TO 19 YEARS
96.3/ 100
METRIC RATING
91st/ 347
METRIC RANK
26.2%
UNEMPLOYMENT AMONG AGES 16 TO 19 YEARS
0.0/ 100
METRIC RATING
340th/ 347
METRIC RANK
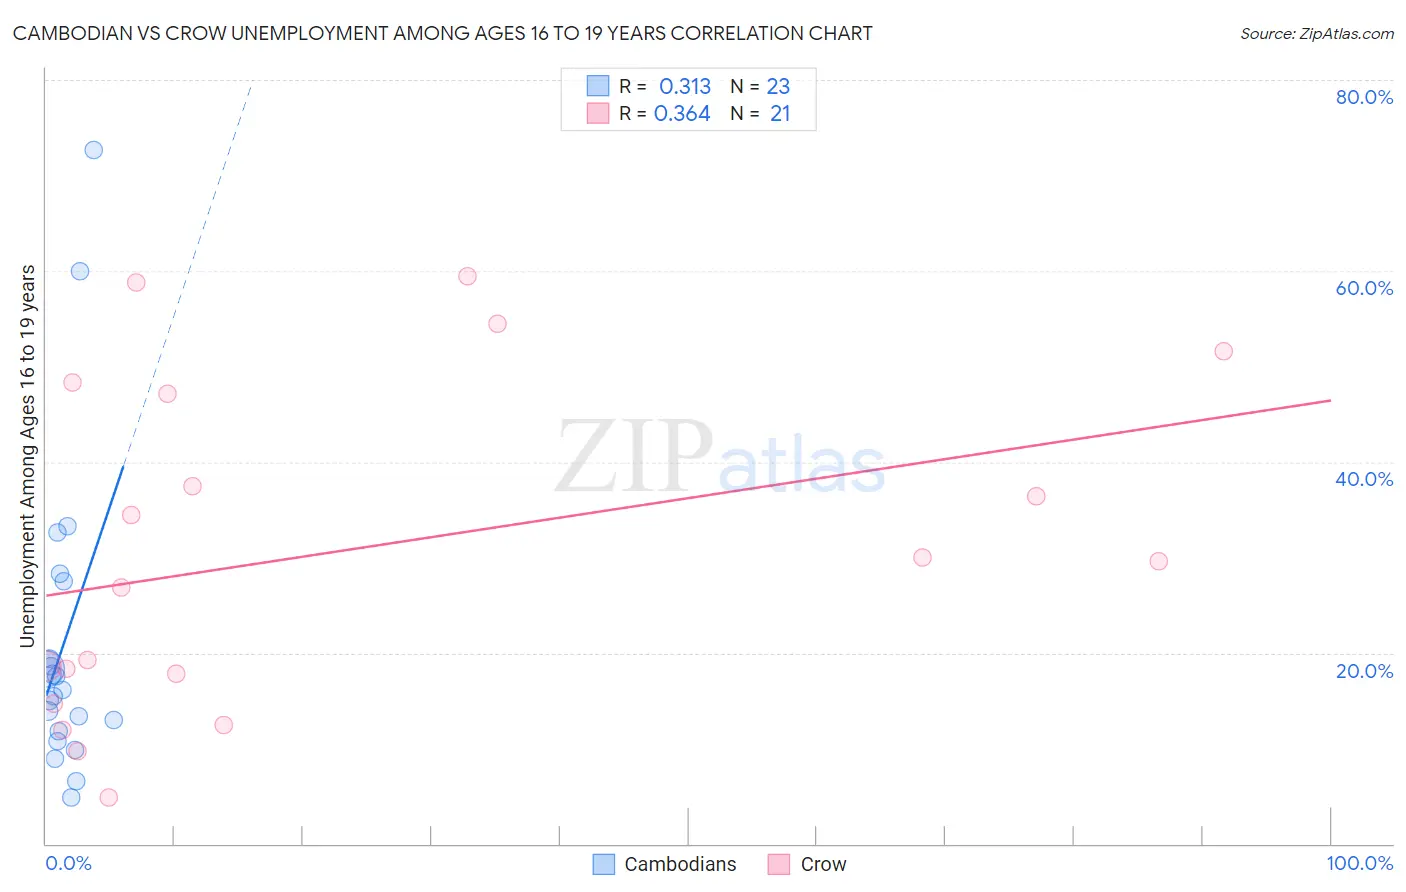
Cambodian vs Crow Unemployment Among Ages 16 to 19 years Correlation Chart
The statistical analysis conducted on geographies consisting of 100,775,991 people shows a mild positive correlation between the proportion of Cambodians and unemployment rate among population between the ages 16 and 19 in the United States with a correlation coefficient (R) of 0.313 and weighted average of 16.9%. Similarly, the statistical analysis conducted on geographies consisting of 58,198,478 people shows a mild positive correlation between the proportion of Crow and unemployment rate among population between the ages 16 and 19 in the United States with a correlation coefficient (R) of 0.364 and weighted average of 26.2%, a difference of 55.3%.
Unemployment Among Ages 16 to 19 years Correlation Summary
| Measurement | Cambodian | Crow |
| Minimum | 4.9% | 4.9% |
| Maximum | 72.7% | 59.4% |
| Range | 67.8% | 54.5% |
| Mean | 21.1% | 30.6% |
| Median | 16.2% | 29.6% |
| Interquartile 25% (IQ1) | 11.8% | 16.2% |
| Interquartile 75% (IQ3) | 27.4% | 47.7% |
| Interquartile Range (IQR) | 15.6% | 31.5% |
| Standard Deviation (Sample) | 16.3% | 17.3% |
| Standard Deviation (Population) | 15.9% | 16.8% |
Similar Demographics by Unemployment Among Ages 16 to 19 years
Demographics Similar to Cambodians by Unemployment Among Ages 16 to 19 years
In terms of unemployment among ages 16 to 19 years, the demographic groups most similar to Cambodians are Asian (16.9%, a difference of 0.080%), Canadian (16.9%, a difference of 0.12%), South African (16.9%, a difference of 0.13%), Cuban (16.9%, a difference of 0.17%), and Bangladeshi (16.9%, a difference of 0.19%).
| Demographics | Rating | Rank | Unemployment Among Ages 16 to 19 years |
| French | 97.4 /100 | #84 | Exceptional 16.8% |
| Immigrants | Kuwait | 97.2 /100 | #85 | Exceptional 16.8% |
| Immigrants | Scotland | 97.2 /100 | #86 | Exceptional 16.8% |
| Greeks | 97.0 /100 | #87 | Exceptional 16.9% |
| Immigrants | South Africa | 96.9 /100 | #88 | Exceptional 16.9% |
| Canadians | 96.7 /100 | #89 | Exceptional 16.9% |
| Asians | 96.6 /100 | #90 | Exceptional 16.9% |
| Cambodians | 96.3 /100 | #91 | Exceptional 16.9% |
| South Africans | 95.9 /100 | #92 | Exceptional 16.9% |
| Cubans | 95.8 /100 | #93 | Exceptional 16.9% |
| Bangladeshis | 95.8 /100 | #94 | Exceptional 16.9% |
| Mongolians | 95.6 /100 | #95 | Exceptional 16.9% |
| Ottawa | 95.4 /100 | #96 | Exceptional 16.9% |
| Immigrants | Venezuela | 95.3 /100 | #97 | Exceptional 16.9% |
| Burmese | 95.0 /100 | #98 | Exceptional 17.0% |
Demographics Similar to Crow by Unemployment Among Ages 16 to 19 years
In terms of unemployment among ages 16 to 19 years, the demographic groups most similar to Crow are Immigrants from Grenada (25.7%, a difference of 1.9%), Immigrants from St. Vincent and the Grenadines (25.7%, a difference of 2.1%), Immigrants from Guyana (25.5%, a difference of 2.9%), Kiowa (25.2%, a difference of 4.1%), and Arapaho (25.2%, a difference of 4.3%).
| Demographics | Rating | Rank | Unemployment Among Ages 16 to 19 years |
| Paiute | 0.0 /100 | #333 | Tragic 24.4% |
| Guyanese | 0.0 /100 | #334 | Tragic 24.8% |
| Arapaho | 0.0 /100 | #335 | Tragic 25.2% |
| Kiowa | 0.0 /100 | #336 | Tragic 25.2% |
| Immigrants | Guyana | 0.0 /100 | #337 | Tragic 25.5% |
| Immigrants | St. Vincent and the Grenadines | 0.0 /100 | #338 | Tragic 25.7% |
| Immigrants | Grenada | 0.0 /100 | #339 | Tragic 25.7% |
| Crow | 0.0 /100 | #340 | Tragic 26.2% |
| Puerto Ricans | 0.0 /100 | #341 | Tragic 27.5% |
| Inupiat | 0.0 /100 | #342 | Tragic 28.1% |
| Navajo | 0.0 /100 | #343 | Tragic 29.0% |
| Colville | 0.0 /100 | #344 | Tragic 29.7% |
| Hopi | 0.0 /100 | #345 | Tragic 30.7% |
| Yuman | 0.0 /100 | #346 | Tragic 37.4% |
| Yup'ik | 0.0 /100 | #347 | Tragic 41.0% |