Cambodian vs Crow Householder Income Ages 25 - 44 years
COMPARE
Cambodian
Crow
Householder Income Ages 25 - 44 years
Householder Income Ages 25 - 44 years Comparison
Cambodians
Crow
$107,148
HOUSEHOLDER INCOME AGES 25 - 44 YEARS
99.9/ 100
METRIC RATING
50th/ 347
METRIC RANK
$71,337
HOUSEHOLDER INCOME AGES 25 - 44 YEARS
0.0/ 100
METRIC RATING
342nd/ 347
METRIC RANK
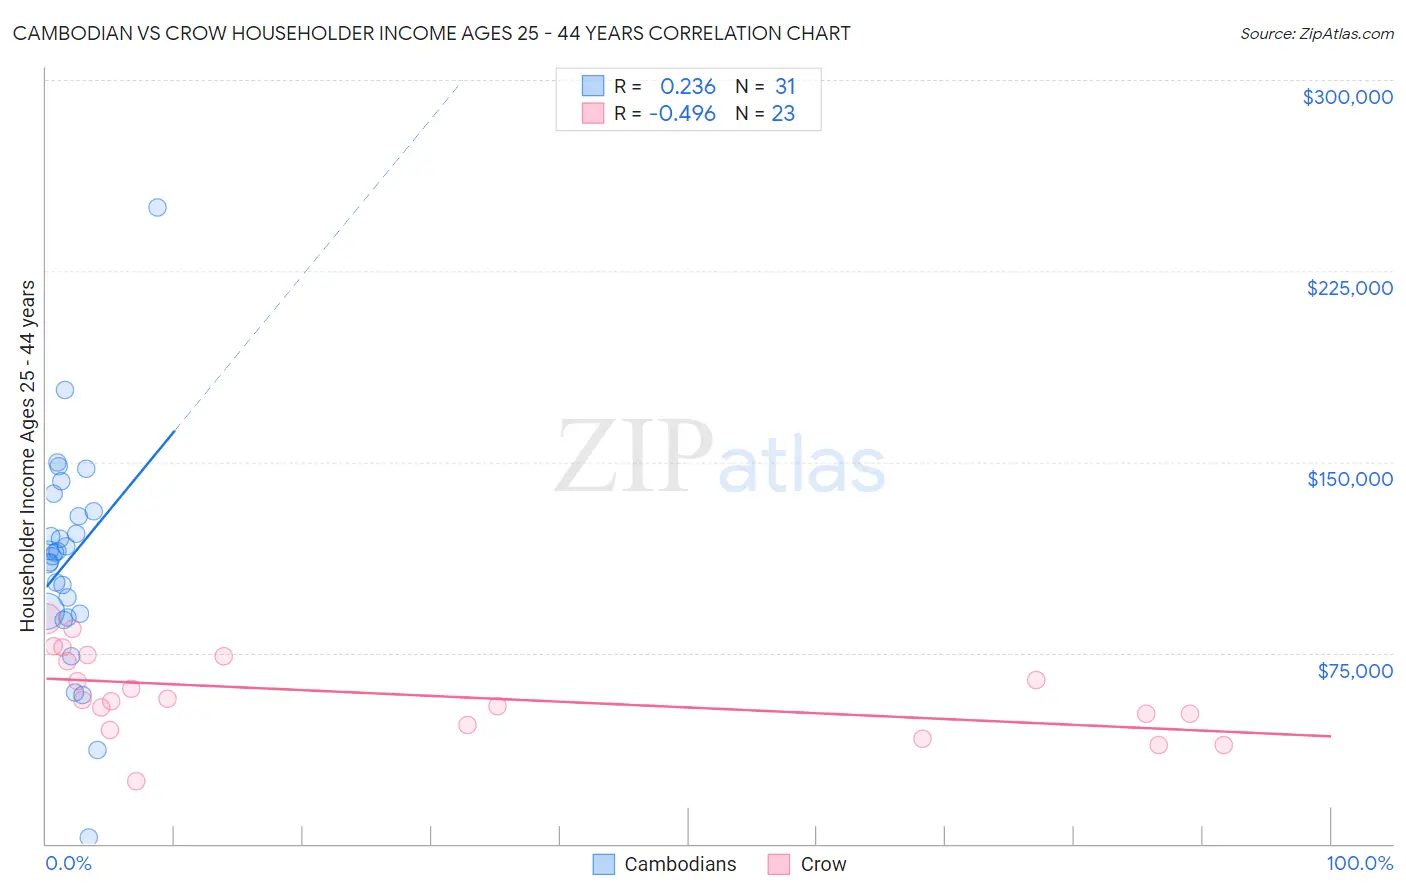
Cambodian vs Crow Householder Income Ages 25 - 44 years Correlation Chart
The statistical analysis conducted on geographies consisting of 102,421,447 people shows a weak positive correlation between the proportion of Cambodians and household income with householder between the ages 25 and 44 in the United States with a correlation coefficient (R) of 0.236 and weighted average of $107,148. Similarly, the statistical analysis conducted on geographies consisting of 59,146,182 people shows a moderate negative correlation between the proportion of Crow and household income with householder between the ages 25 and 44 in the United States with a correlation coefficient (R) of -0.496 and weighted average of $71,337, a difference of 50.2%.
Householder Income Ages 25 - 44 years Correlation Summary
| Measurement | Cambodian | Crow |
| Minimum | $2,499 | $24,750 |
| Maximum | $250,001 | $88,221 |
| Range | $247,502 | $63,471 |
| Mean | $111,649 | $58,648 |
| Median | $114,305 | $56,586 |
| Interquartile 25% (IQ1) | $90,341 | $46,651 |
| Interquartile 75% (IQ3) | $130,756 | $73,750 |
| Interquartile Range (IQR) | $40,415 | $27,099 |
| Standard Deviation (Sample) | $43,612 | $16,111 |
| Standard Deviation (Population) | $42,903 | $15,756 |
Similar Demographics by Householder Income Ages 25 - 44 years
Demographics Similar to Cambodians by Householder Income Ages 25 - 44 years
In terms of householder income ages 25 - 44 years, the demographic groups most similar to Cambodians are Immigrants from Turkey ($107,258, a difference of 0.10%), Estonian ($107,269, a difference of 0.11%), Bulgarian ($107,264, a difference of 0.11%), Immigrants from Belarus ($107,393, a difference of 0.23%), and Immigrants from Czechoslovakia ($106,888, a difference of 0.24%).
| Demographics | Rating | Rank | Householder Income Ages 25 - 44 years |
| Immigrants | Malaysia | 99.9 /100 | #43 | Exceptional $107,650 |
| Immigrants | Indonesia | 99.9 /100 | #44 | Exceptional $107,627 |
| Israelis | 99.9 /100 | #45 | Exceptional $107,579 |
| Immigrants | Belarus | 99.9 /100 | #46 | Exceptional $107,393 |
| Estonians | 99.9 /100 | #47 | Exceptional $107,269 |
| Bulgarians | 99.9 /100 | #48 | Exceptional $107,264 |
| Immigrants | Turkey | 99.9 /100 | #49 | Exceptional $107,258 |
| Cambodians | 99.9 /100 | #50 | Exceptional $107,148 |
| Immigrants | Czechoslovakia | 99.9 /100 | #51 | Exceptional $106,888 |
| Immigrants | Europe | 99.9 /100 | #52 | Exceptional $106,817 |
| Immigrants | Norway | 99.9 /100 | #53 | Exceptional $106,629 |
| Paraguayans | 99.9 /100 | #54 | Exceptional $106,615 |
| Greeks | 99.9 /100 | #55 | Exceptional $106,457 |
| Immigrants | Pakistan | 99.8 /100 | #56 | Exceptional $106,129 |
| Immigrants | Austria | 99.8 /100 | #57 | Exceptional $106,103 |
Demographics Similar to Crow by Householder Income Ages 25 - 44 years
In terms of householder income ages 25 - 44 years, the demographic groups most similar to Crow are Arapaho ($71,697, a difference of 0.50%), Immigrants from Congo ($72,178, a difference of 1.2%), Yuman ($72,956, a difference of 2.3%), Immigrants from Yemen ($73,043, a difference of 2.4%), and Black/African American ($73,370, a difference of 2.9%).
| Demographics | Rating | Rank | Householder Income Ages 25 - 44 years |
| Hopi | 0.0 /100 | #333 | Tragic $75,002 |
| Creek | 0.0 /100 | #334 | Tragic $74,847 |
| Kiowa | 0.0 /100 | #335 | Tragic $74,776 |
| Yup'ik | 0.0 /100 | #336 | Tragic $73,688 |
| Blacks/African Americans | 0.0 /100 | #337 | Tragic $73,370 |
| Immigrants | Yemen | 0.0 /100 | #338 | Tragic $73,043 |
| Yuman | 0.0 /100 | #339 | Tragic $72,956 |
| Immigrants | Congo | 0.0 /100 | #340 | Tragic $72,178 |
| Arapaho | 0.0 /100 | #341 | Tragic $71,697 |
| Crow | 0.0 /100 | #342 | Tragic $71,337 |
| Tohono O'odham | 0.0 /100 | #343 | Tragic $69,068 |
| Pueblo | 0.0 /100 | #344 | Tragic $68,910 |
| Navajo | 0.0 /100 | #345 | Tragic $66,529 |
| Puerto Ricans | 0.0 /100 | #346 | Tragic $65,996 |
| Lumbee | 0.0 /100 | #347 | Tragic $60,305 |