Cajun vs Immigrants from North Macedonia Female Unemployment
COMPARE
Cajun
Immigrants from North Macedonia
Female Unemployment
Female Unemployment Comparison
Cajuns
Immigrants from North Macedonia
5.7%
FEMALE UNEMPLOYMENT
0.7/ 100
METRIC RATING
252nd/ 347
METRIC RANK
5.1%
FEMALE UNEMPLOYMENT
88.3/ 100
METRIC RATING
119th/ 347
METRIC RANK
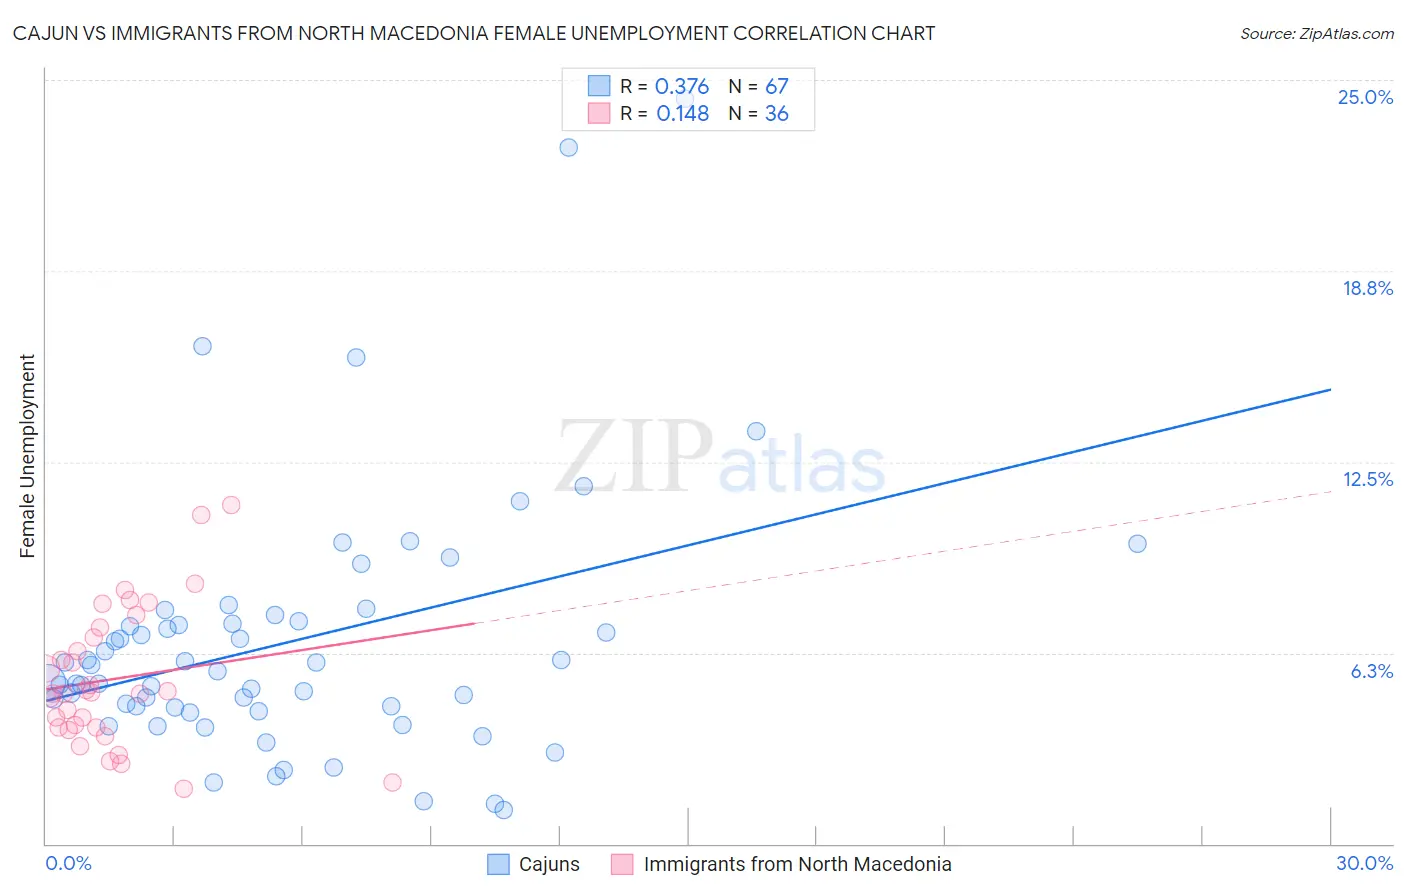
Cajun vs Immigrants from North Macedonia Female Unemployment Correlation Chart
The statistical analysis conducted on geographies consisting of 149,152,884 people shows a mild positive correlation between the proportion of Cajuns and unemploymnet rate among females in the United States with a correlation coefficient (R) of 0.376 and weighted average of 5.7%. Similarly, the statistical analysis conducted on geographies consisting of 74,255,623 people shows a poor positive correlation between the proportion of Immigrants from North Macedonia and unemploymnet rate among females in the United States with a correlation coefficient (R) of 0.148 and weighted average of 5.1%, a difference of 10.9%.
Female Unemployment Correlation Summary
| Measurement | Cajun | Immigrants from North Macedonia |
| Minimum | 1.1% | 1.8% |
| Maximum | 24.4% | 11.1% |
| Range | 23.3% | 9.3% |
| Mean | 6.6% | 5.4% |
| Median | 5.6% | 4.9% |
| Interquartile 25% (IQ1) | 4.4% | 3.8% |
| Interquartile 75% (IQ3) | 7.3% | 6.9% |
| Interquartile Range (IQR) | 2.8% | 3.1% |
| Standard Deviation (Sample) | 4.3% | 2.3% |
| Standard Deviation (Population) | 4.2% | 2.2% |
Similar Demographics by Female Unemployment
Demographics Similar to Cajuns by Female Unemployment
In terms of female unemployment, the demographic groups most similar to Cajuns are Immigrants from Sierra Leone (5.7%, a difference of 0.15%), Immigrants (5.7%, a difference of 0.15%), Immigrants from Cameroon (5.7%, a difference of 0.18%), Assyrian/Chaldean/Syriac (5.6%, a difference of 0.20%), and Immigrants from Syria (5.6%, a difference of 0.26%).
| Demographics | Rating | Rank | Female Unemployment |
| Guamanians/Chamorros | 1.4 /100 | #245 | Tragic 5.6% |
| Japanese | 1.2 /100 | #246 | Tragic 5.6% |
| Immigrants | Western Asia | 1.1 /100 | #247 | Tragic 5.6% |
| Cree | 1.0 /100 | #248 | Tragic 5.6% |
| Immigrants | Uzbekistan | 1.0 /100 | #249 | Tragic 5.6% |
| Immigrants | Syria | 0.8 /100 | #250 | Tragic 5.6% |
| Assyrians/Chaldeans/Syriacs | 0.8 /100 | #251 | Tragic 5.6% |
| Cajuns | 0.7 /100 | #252 | Tragic 5.7% |
| Immigrants | Sierra Leone | 0.6 /100 | #253 | Tragic 5.7% |
| Immigrants | Immigrants | 0.6 /100 | #254 | Tragic 5.7% |
| Immigrants | Cameroon | 0.6 /100 | #255 | Tragic 5.7% |
| Sub-Saharan Africans | 0.4 /100 | #256 | Tragic 5.7% |
| Dutch West Indians | 0.3 /100 | #257 | Tragic 5.7% |
| Immigrants | Portugal | 0.2 /100 | #258 | Tragic 5.8% |
| Immigrants | Fiji | 0.2 /100 | #259 | Tragic 5.8% |
Demographics Similar to Immigrants from North Macedonia by Female Unemployment
In terms of female unemployment, the demographic groups most similar to Immigrants from North Macedonia are Immigrants from Romania (5.1%, a difference of 0.020%), Immigrants from Western Europe (5.1%, a difference of 0.030%), Immigrants from Germany (5.1%, a difference of 0.10%), Immigrants from South Africa (5.1%, a difference of 0.10%), and Immigrants from Europe (5.1%, a difference of 0.15%).
| Demographics | Rating | Rank | Female Unemployment |
| Estonians | 92.1 /100 | #112 | Exceptional 5.1% |
| Immigrants | Saudi Arabia | 91.2 /100 | #113 | Exceptional 5.1% |
| Immigrants | Turkey | 91.0 /100 | #114 | Exceptional 5.1% |
| Lebanese | 91.0 /100 | #115 | Exceptional 5.1% |
| Americans | 90.5 /100 | #116 | Exceptional 5.1% |
| Jordanians | 90.3 /100 | #117 | Exceptional 5.1% |
| Immigrants | Croatia | 89.9 /100 | #118 | Excellent 5.1% |
| Immigrants | North Macedonia | 88.3 /100 | #119 | Excellent 5.1% |
| Immigrants | Romania | 88.1 /100 | #120 | Excellent 5.1% |
| Immigrants | Western Europe | 88.1 /100 | #121 | Excellent 5.1% |
| Immigrants | Germany | 87.6 /100 | #122 | Excellent 5.1% |
| Immigrants | South Africa | 87.6 /100 | #123 | Excellent 5.1% |
| Immigrants | Europe | 87.2 /100 | #124 | Excellent 5.1% |
| Basques | 86.5 /100 | #125 | Excellent 5.1% |
| Immigrants | Korea | 86.3 /100 | #126 | Excellent 5.1% |