Burmese vs Black/African American Unemployment Among Youth under 25 years
COMPARE
Burmese
Black/African American
Unemployment Among Youth under 25 years
Unemployment Among Youth under 25 years Comparison
Burmese
Blacks/African Americans
11.3%
UNEMPLOYMENT AMONG YOUTH UNDER 25 YEARS
89.8/ 100
METRIC RATING
116th/ 347
METRIC RANK
14.5%
UNEMPLOYMENT AMONG YOUTH UNDER 25 YEARS
0.0/ 100
METRIC RATING
317th/ 347
METRIC RANK
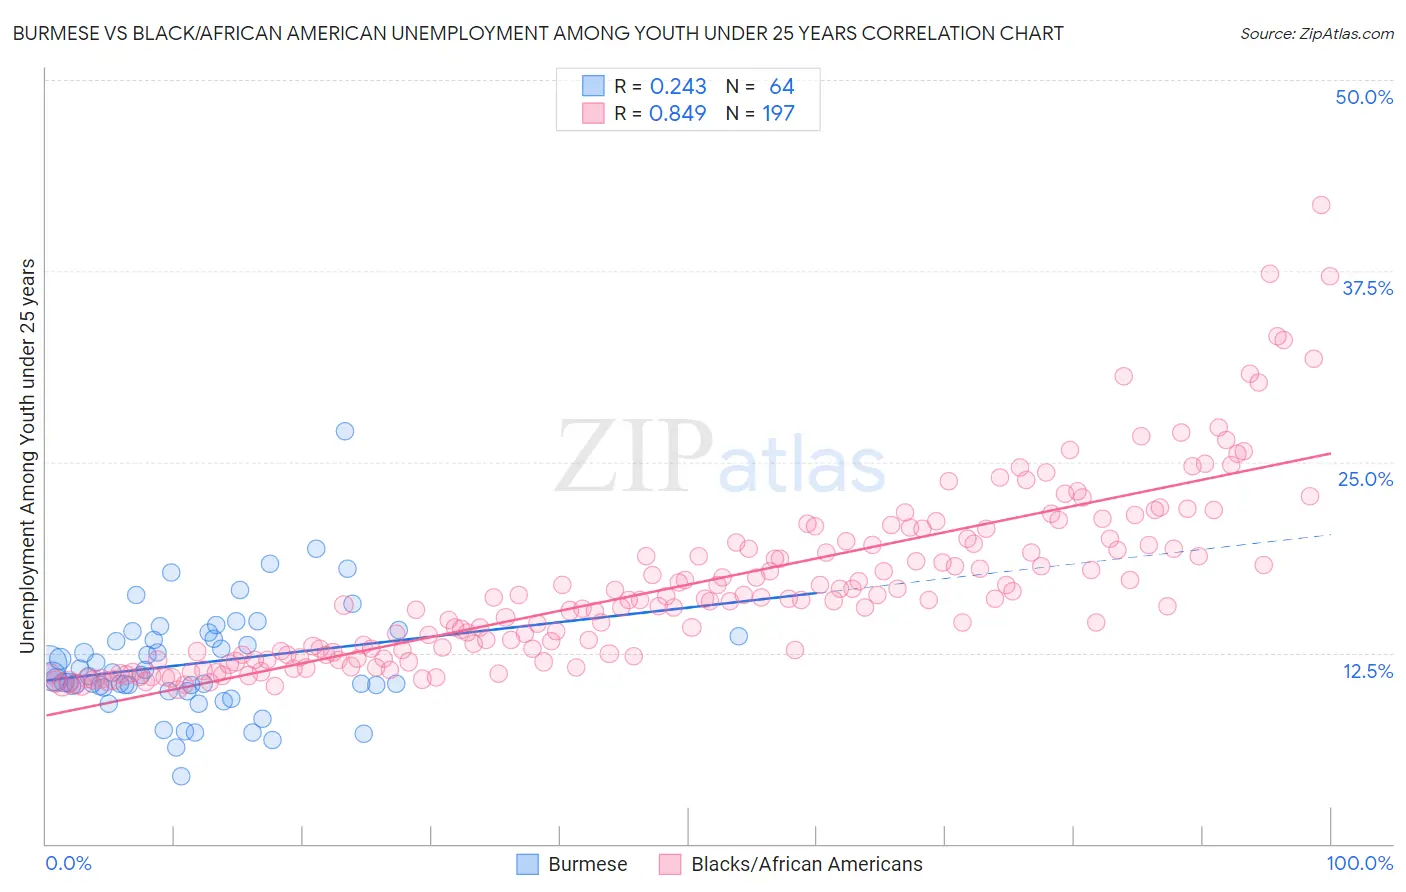
Burmese vs Black/African American Unemployment Among Youth under 25 years Correlation Chart
The statistical analysis conducted on geographies consisting of 457,894,407 people shows a weak positive correlation between the proportion of Burmese and unemployment rate among youth under the age of 25 in the United States with a correlation coefficient (R) of 0.243 and weighted average of 11.3%. Similarly, the statistical analysis conducted on geographies consisting of 545,283,249 people shows a very strong positive correlation between the proportion of Blacks/African Americans and unemployment rate among youth under the age of 25 in the United States with a correlation coefficient (R) of 0.849 and weighted average of 14.5%, a difference of 27.6%.
Unemployment Among Youth under 25 years Correlation Summary
| Measurement | Burmese | Black/African American |
| Minimum | 4.4% | 10.1% |
| Maximum | 27.0% | 41.8% |
| Range | 22.6% | 31.7% |
| Mean | 11.8% | 16.9% |
| Median | 11.0% | 15.9% |
| Interquartile 25% (IQ1) | 10.3% | 12.2% |
| Interquartile 75% (IQ3) | 13.5% | 19.6% |
| Interquartile Range (IQR) | 3.2% | 7.4% |
| Standard Deviation (Sample) | 3.6% | 5.8% |
| Standard Deviation (Population) | 3.5% | 5.8% |
Similar Demographics by Unemployment Among Youth under 25 years
Demographics Similar to Burmese by Unemployment Among Youth under 25 years
In terms of unemployment among youth under 25 years, the demographic groups most similar to Burmese are Immigrants from Vietnam (11.3%, a difference of 0.010%), Sri Lankan (11.3%, a difference of 0.010%), Afghan (11.3%, a difference of 0.010%), Immigrants from Ethiopia (11.3%, a difference of 0.020%), and Fijian (11.3%, a difference of 0.050%).
| Demographics | Rating | Rank | Unemployment Among Youth under 25 years |
| Iranians | 92.0 /100 | #109 | Exceptional 11.3% |
| Immigrants | Norway | 91.5 /100 | #110 | Exceptional 11.3% |
| Immigrants | France | 90.3 /100 | #111 | Exceptional 11.3% |
| Immigrants | Austria | 90.3 /100 | #112 | Exceptional 11.3% |
| Fijians | 90.2 /100 | #113 | Exceptional 11.3% |
| Immigrants | Ethiopia | 89.9 /100 | #114 | Excellent 11.3% |
| Immigrants | Vietnam | 89.9 /100 | #115 | Excellent 11.3% |
| Burmese | 89.8 /100 | #116 | Excellent 11.3% |
| Sri Lankans | 89.8 /100 | #117 | Excellent 11.3% |
| Afghans | 89.7 /100 | #118 | Excellent 11.3% |
| Immigrants | Scotland | 89.2 /100 | #119 | Excellent 11.4% |
| Malaysians | 89.0 /100 | #120 | Excellent 11.4% |
| Slovaks | 88.9 /100 | #121 | Excellent 11.4% |
| Immigrants | Micronesia | 88.1 /100 | #122 | Excellent 11.4% |
| Basques | 87.8 /100 | #123 | Excellent 11.4% |
Demographics Similar to Blacks/African Americans by Unemployment Among Youth under 25 years
In terms of unemployment among youth under 25 years, the demographic groups most similar to Blacks/African Americans are Native/Alaskan (14.5%, a difference of 0.090%), Sioux (14.4%, a difference of 0.51%), Jamaican (14.4%, a difference of 0.63%), Immigrants from Armenia (14.4%, a difference of 0.71%), and Immigrants from Dominica (14.6%, a difference of 0.72%).
| Demographics | Rating | Rank | Unemployment Among Youth under 25 years |
| Immigrants | West Indies | 0.0 /100 | #310 | Tragic 14.2% |
| Immigrants | Bangladesh | 0.0 /100 | #311 | Tragic 14.2% |
| Vietnamese | 0.0 /100 | #312 | Tragic 14.3% |
| Immigrants | Armenia | 0.0 /100 | #313 | Tragic 14.4% |
| Jamaicans | 0.0 /100 | #314 | Tragic 14.4% |
| Sioux | 0.0 /100 | #315 | Tragic 14.4% |
| Natives/Alaskans | 0.0 /100 | #316 | Tragic 14.5% |
| Blacks/African Americans | 0.0 /100 | #317 | Tragic 14.5% |
| Immigrants | Dominica | 0.0 /100 | #318 | Tragic 14.6% |
| West Indians | 0.0 /100 | #319 | Tragic 14.6% |
| Barbadians | 0.0 /100 | #320 | Tragic 14.6% |
| Cheyenne | 0.0 /100 | #321 | Tragic 14.6% |
| Trinidadians and Tobagonians | 0.0 /100 | #322 | Tragic 14.6% |
| Immigrants | Trinidad and Tobago | 0.0 /100 | #323 | Tragic 14.6% |
| Immigrants | Jamaica | 0.0 /100 | #324 | Tragic 14.8% |